

Question
Graph the data using a scatter chart Identify a peak you would like to investigate Calculate the slope of 4 sets of points around the
Graph the data using a scatter chart
Identify a peak you would like to investigate
Calculate the slope of 4 sets of points around the peak. You should have 3 slopes. On the excel sheet.
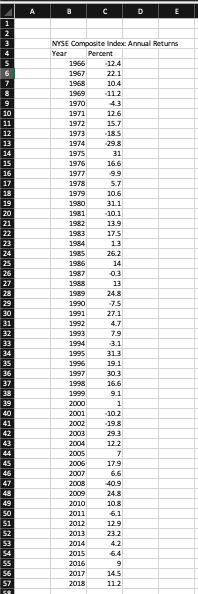
B D E 16 17 18 19 20 21 22 24 26 27 28 29 30 31 NYSE Composite Index: Annual Returns Year Percent 1956 -12.4 1967 221 1958 10.4 1959 -112 1970 43 1971 12.6 1972 15.7 1973 -18.5 1974 29.8 1975 31 1976 16.6 1977 1978 5.7 1979 10.6 1980 311 1981 10.1 1982 139 1983 17.5 1984 13 1985 262 1986 14 1987 03 1988 13 1989 24.8 1990 -75 1991 27.1 1992 4.7 1993 79 1994 3.1 1995 313 1996 19.1 1997 303 1998 16.6 1999 9.1 2000 1 2001 -10.2 2002 19.8 2003 293 2004 122 2005 7 2006 17-9 2007 6.6 2008 40.9 2009 24.8 2010 10.8 2011 2012 129 2013 23.2 2014 4.2 2015 6.4 2016 2017 145 2018 112 33 34 35 36 37 38 39 40 41 42 43 45 46 49 49 SO 51 52 53 54 SS 56 57 51 B D E 16 17 18 19 20 21 22 24 26 27 28 29 30 31 NYSE Composite Index: Annual Returns Year Percent 1956 -12.4 1967 221 1958 10.4 1959 -112 1970 43 1971 12.6 1972 15.7 1973 -18.5 1974 29.8 1975 31 1976 16.6 1977 1978 5.7 1979 10.6 1980 311 1981 10.1 1982 139 1983 17.5 1984 13 1985 262 1986 14 1987 03 1988 13 1989 24.8 1990 -75 1991 27.1 1992 4.7 1993 79 1994 3.1 1995 313 1996 19.1 1997 303 1998 16.6 1999 9.1 2000 1 2001 -10.2 2002 19.8 2003 293 2004 122 2005 7 2006 17-9 2007 6.6 2008 40.9 2009 24.8 2010 10.8 2011 2012 129 2013 23.2 2014 4.2 2015 6.4 2016 2017 145 2018 112 33 34 35 36 37 38 39 40 41 42 43 45 46 49 49 SO 51 52 53 54 SS 56 57 51Step by Step Solution
There are 3 Steps involved in it
Step: 1

Get Instant Access to Expert-Tailored Solutions
See step-by-step solutions with expert insights and AI powered tools for academic success
Step: 2

Step: 3
Ace Your Homework with AI
Get the answers you need in no time with our AI-driven, step-by-step assistance
Get Started
Practical Financial Management
Authors: William R. Lasher
7th edition
128560721X, 9781133593669, 1133593682, 9781285607214, 978-1133593683