Answered step by step
Verified Expert Solution
Link Copied!

Question

1 Approved Answer

Graphical Analysis in Exercises 9-14, use the values on the number line to find the error of estimate. 9. begin{tabularrrrr} & multicolumn{1}{c} {$bar{x}=3.8$] & multicolumn{1}{c}{$mu=4.27$]
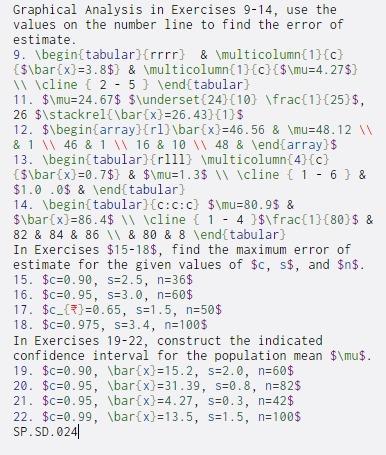
image text in transcribed

Graphical Analysis in Exercises 9-14, use the values on the number line to find the error of estimate. 9. \begin{tabularrrrr} & \multicolumn{1}{c} {$\bar{x}=3.8$] & \multicolumn{1}{c}{$\mu=4.27$] \cline (2 - 5\end{tabular) 11. $\mu=24.67$ $\underset[2410] \frac{1}{25)$, 26 $\stackrel{\bar{x}=26.43}{1}$ 12. $\begin{array}{rl}\bar{x}=46.56 & \mu=48.12 W &1 46 & 1 16 & 10 48 & \end{array}$ 13. \begin{tabular}{rlll} \multicolumn{4}{c} {$\bar{x}=0.7$] & $\mu=1.3$ \ \cline {1 - 6} & $1.0.0$ & \end{tabular) 14. \begin{tabular}{c:c:c} $\mu=80.99 & $\bar{x}=86.4$ \ \cline { 1 - 4 ]$\frac{1}{80]$ & 82 & 84 & 86 \\ & 80 & 8 \end{tabular) In Exercises $15-18$, find the maximum error of estimate for the given values of $c, s$, and $n$. 15. $c=0.90, s=2.5, n=36$ 16. $c=0.95, s=3.0, n=60$ 17. $c_{*}=0.65, s=1.5, n=50$ 18. $C=0.975, s=3.4, n=100$ In Exercises 19-22, construct the indicated confidence interval for the population mean $\mu$. 19. $c=0.90, \bar{x}=15.2, s=2.0, n=60$ 20. $c=0.95, \bar{x}=31.39, S=0.8, n=82$ 21. $c=0.95, \bar{x}=4.27, s=0.3, n=42$ 22. $c=0.99, \bar{x}=13.5, s=1.5, n=100$ SP.SD.024

Step by Step Solution

There are 3 Steps involved in it

Step: 1

blur-text-image

Get Instant Access to Expert-Tailored Solutions

See step-by-step solutions with expert insights and AI powered tools for academic success

Step: 2

blur-text-image

Step: 3

blur-text-image

Ace Your Homework with AI

Get the answers you need in no time with our AI-driven, step-by-step assistance

Get Started

Recommended Textbook for

More Books

Students also viewed these Databases questions

Question

=+j Explain IHRMs role in global HR research.

Answered: 1 week ago