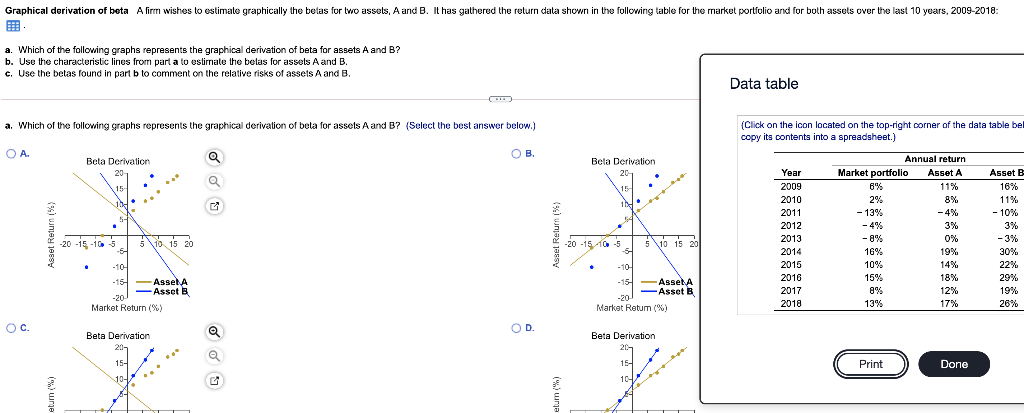
Graphical derivation of beta A firmi wishes to estimate graphically the beas for two assets, A and B. It has gathered the return data shown in the following table for the market portfolio and for both assets over the last 10 years, 2009-2018: a. Which of the following graphs represents the graphical derivation of beta for assets A and B? b. Use the characteristic lines from part a to estimate the belas for assets A and B. c. Use the betas found in part b to comment on the relative risks of assets A and B. Data table a. Which of the following graphs represents the graphical derivation of bela for assets A and B? (Select the best answer below.) (Click on the icon located on the top-right corner of the data table bel copy its contents into a spreadsheet.) OA. . B a Bela Derivation 20 Bela Derivation 20 e 154 IN 5-1 Year 2009 2010 2011 2012 2013 2014 2015 2016 2017 2018 Annual return Market portfolio Asset A 675 11% 2% 8% - 13% -4% -4% 3% -0% 0% 16% 19% 10% 14% 15% 18% 8% 12% 13% 17% 5 10 15 20 -20 -15 -10 -5 -5- 5 10 15 20 -20 -1510-5 -5 Asset B 16% 11% - 10% 3% -3% 30%. 22% 29% 19% 26% -10 -15 - AsselA Asset B -20 Market Return (%) -10 -15 Asse A Asset B -20 Market Retum (%) OC. OD. Beta Derivation 20 Beta Derivation 20- 15- 10- 15- ( Print Done 104 Graphical derivation of beta A firmi wishes to estimate graphically the beas for two assets, A and B. It has gathered the return data shown in the following table for the market portfolio and for both assets over the last 10 years, 2009-2018: a. Which of the following graphs represents the graphical derivation of beta for assets A and B? b. Use the characteristic lines from part a to estimate the belas for assets A and B. c. Use the betas found in part b to comment on the relative risks of assets A and B. Data table a. Which of the following graphs represents the graphical derivation of bela for assets A and B? (Select the best answer below.) (Click on the icon located on the top-right corner of the data table bel copy its contents into a spreadsheet.) OA. . B a Bela Derivation 20 Bela Derivation 20 e 154 IN 5-1 Year 2009 2010 2011 2012 2013 2014 2015 2016 2017 2018 Annual return Market portfolio Asset A 675 11% 2% 8% - 13% -4% -4% 3% -0% 0% 16% 19% 10% 14% 15% 18% 8% 12% 13% 17% 5 10 15 20 -20 -15 -10 -5 -5- 5 10 15 20 -20 -1510-5 -5 Asset B 16% 11% - 10% 3% -3% 30%. 22% 29% 19% 26% -10 -15 - AsselA Asset B -20 Market Return (%) -10 -15 Asse A Asset B -20 Market Retum (%) OC. OD. Beta Derivation 20 Beta Derivation 20- 15- 10- 15- ( Print Done 104