

Answered step by step
Verified Expert Solution
Question
1 Approved Answer
Graphing a bivariate function and its second order approximation Produce a 3-d plot of the function f(x_1 x_2) = cos (x_1x_2) and Its second order
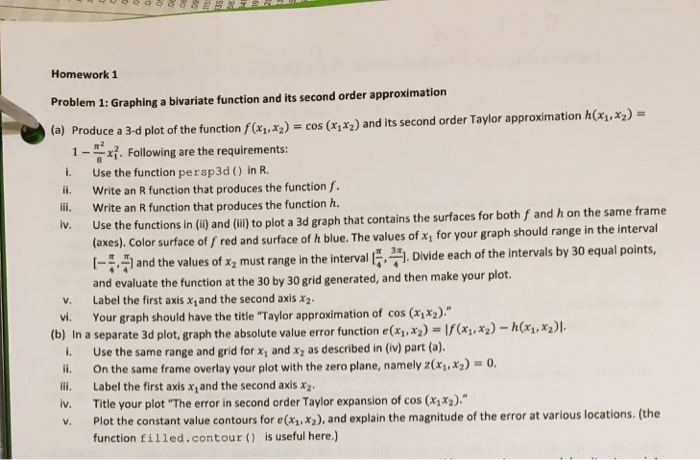 Graphing a bivariate function and its second order approximation Produce a 3-d plot of the function f(x_1 x_2) = cos (x_1x_2) and Its second order Taylor approximation h(x_1x_2) = 1 - pi^2/theta x_1^2. Following are the requirements: Use the function pe rsp3d () in R. Write an R function that produces the function f. Write an R function that produces the function h. Use the functions in (ii) and (iii) to plot a 3d graph that contains the surfaces for both f and h on the same frame (axes). Color surface of f red and surface of h blue. The values of xx for your graph should range in the interval [-pi/4, pi/4] and the values of x2 must range in the interval [pi/4, 3 pi/4]. Divide each of the intervals by 30 equal points, and evaluate the function at the 30 by 30 grid generated, and then make your plot. Label the first axis x, and the second axis x_2. Your graph should have the title "Taylor approximation of cos (x_1 x_2)" In a separate 3d plot, graph the absolute value error function e(x_1, x_2) = |f(x_1, x_2) - h(x_1, x_2)|. Use the same range and grid for x, and x2 as described in (iv) part (a). On the same frame overlay your plot with the zero plane, namely z(x_1, x_2) = 0. Label the first axis x, and the second axis x_2. Title your plot The error in second order Taylor expansion of cos (x_1, x_2). Plot the constant value contours for e(x_1, x_2), and explain the magnitude of the error at various locations, (the function filled, contour () is useful here.) Graphing a bivariate function and its second order approximation Produce a 3-d plot of the function f(x_1 x_2) = cos (x_1x_2) and Its second order Taylor approximation h(x_1x_2) = 1 - pi^2/theta x_1^2. Following are the requirements: Use the function pe rsp3d () in R. Write an R function that produces the function f. Write an R function that produces the function h. Use the functions in (ii) and (iii) to plot a 3d graph that contains the surfaces for both f and h on the same frame (axes). Color surface of f red and surface of h blue. The values of xx for your graph should range in the interval [-pi/4, pi/4] and the values of x2 must range in the interval [pi/4, 3 pi/4]. Divide each of the intervals by 30 equal points, and evaluate the function at the 30 by 30 grid generated, and then make your plot. Label the first axis x, and the second axis x_2. Your graph should have the title "Taylor approximation of cos (x_1 x_2)" In a separate 3d plot, graph the absolute value error function e(x_1, x_2) = |f(x_1, x_2) - h(x_1, x_2)|. Use the same range and grid for x, and x2 as described in (iv) part (a). On the same frame overlay your plot with the zero plane, namely z(x_1, x_2) = 0. Label the first axis x, and the second axis x_2. Title your plot The error in second order Taylor expansion of cos (x_1, x_2). Plot the constant value contours for e(x_1, x_2), and explain the magnitude of the error at various locations, (the function filled, contour () is useful here.)
Step by Step Solution
There are 3 Steps involved in it
Step: 1

Get Instant Access to Expert-Tailored Solutions
See step-by-step solutions with expert insights and AI powered tools for academic success
Step: 2

Step: 3
Ace Your Homework with AI
Get the answers you need in no time with our AI-driven, step-by-step assistance
Get Started
Essential SQLAlchemy Mapping Python To Databases
Authors: Myers, Jason Myers
2nd Edition
1491916567, 9781491916568