

Answered step by step
Verified Expert Solution
Question
1 Approved Answer
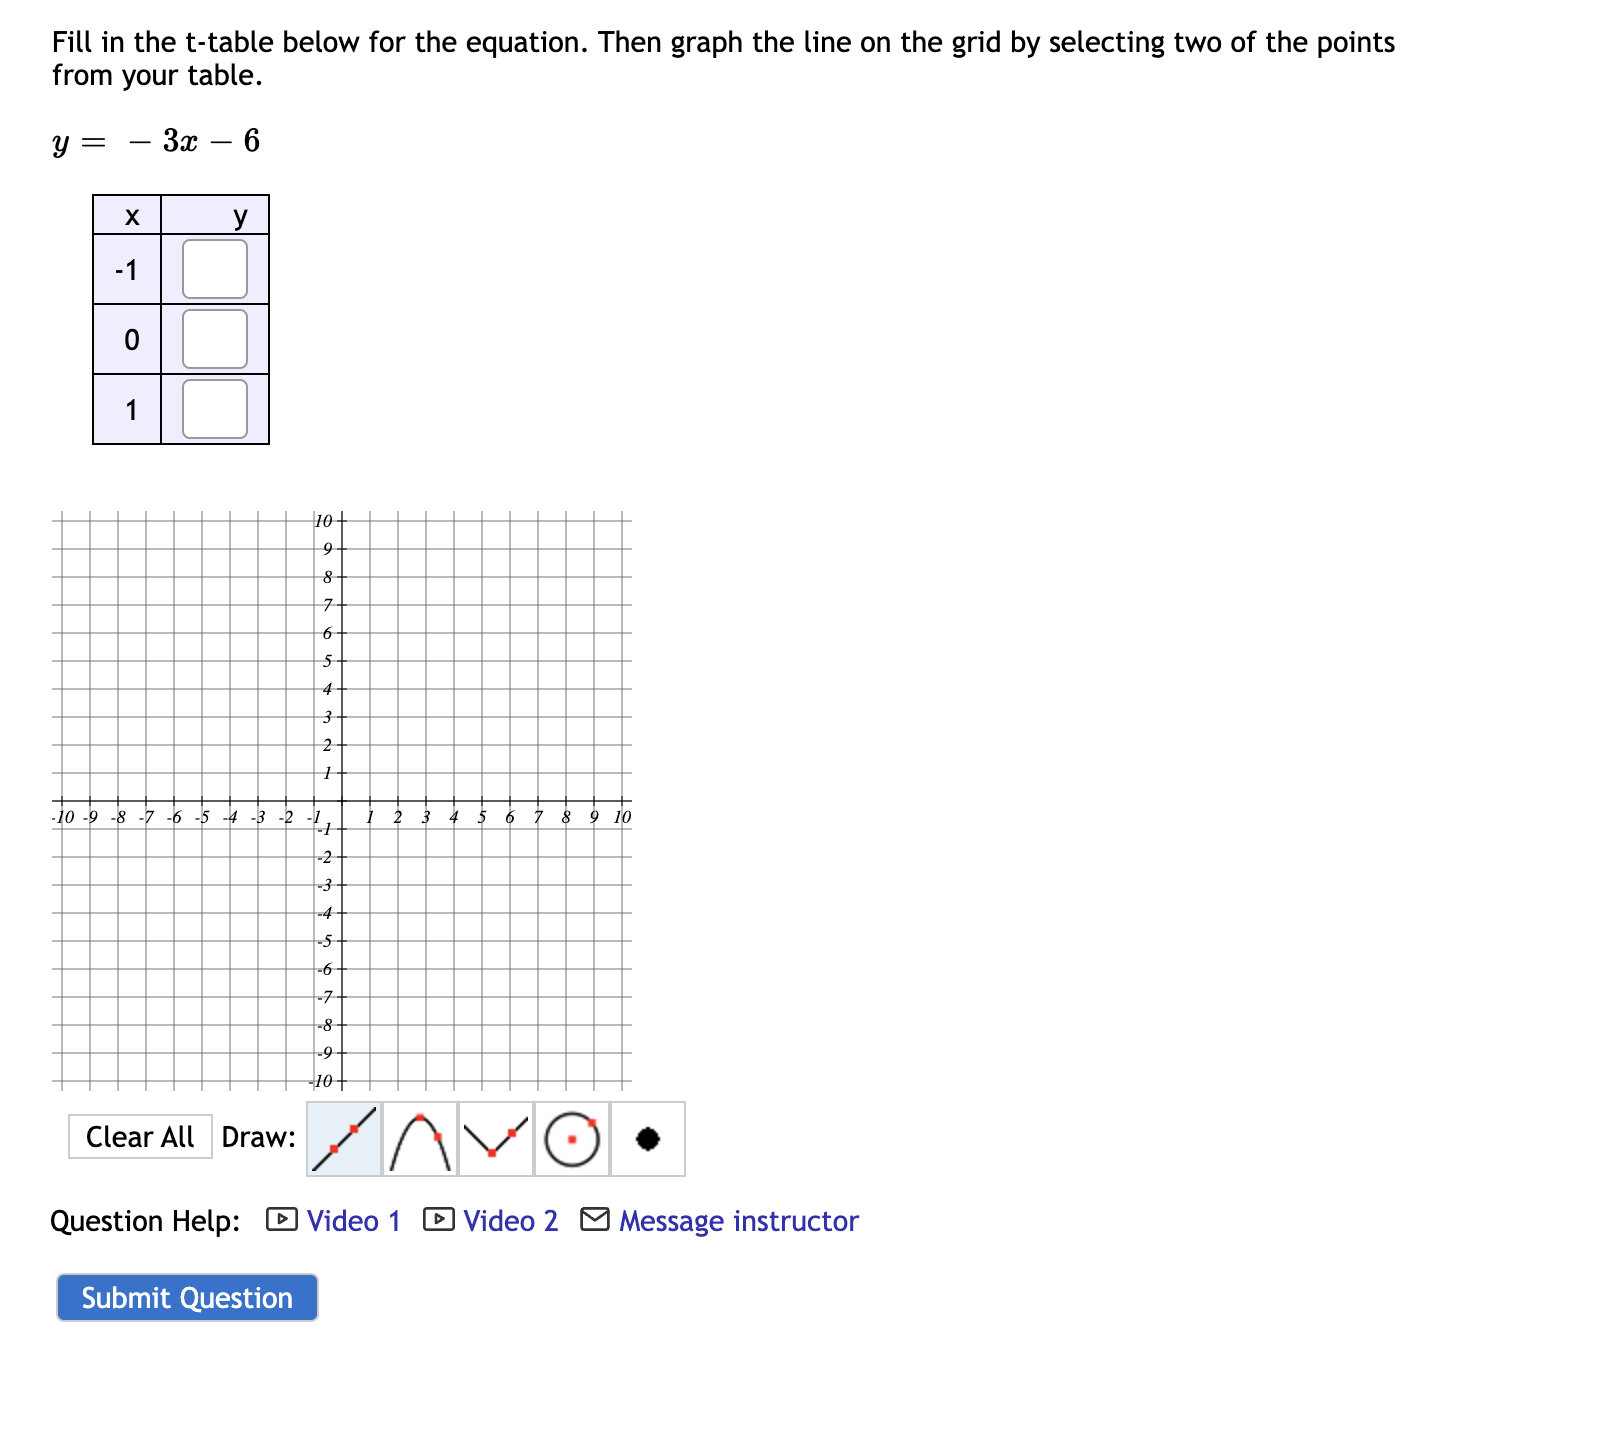
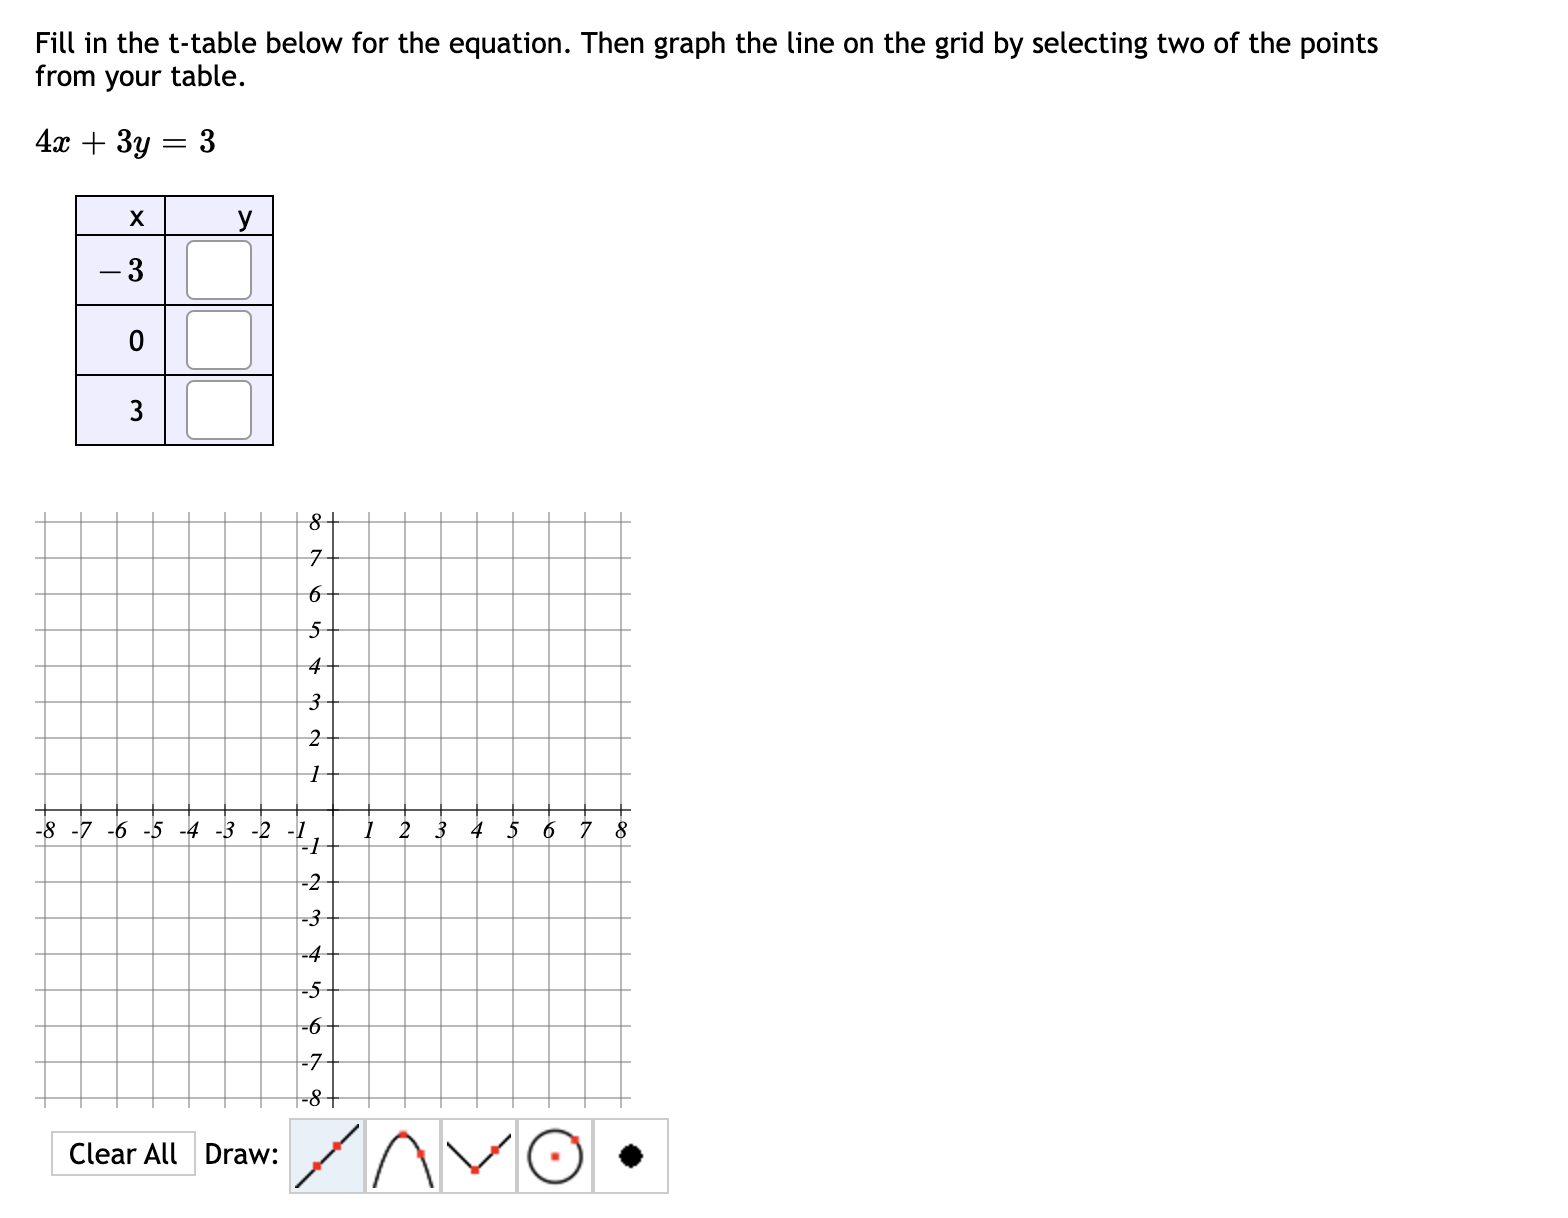
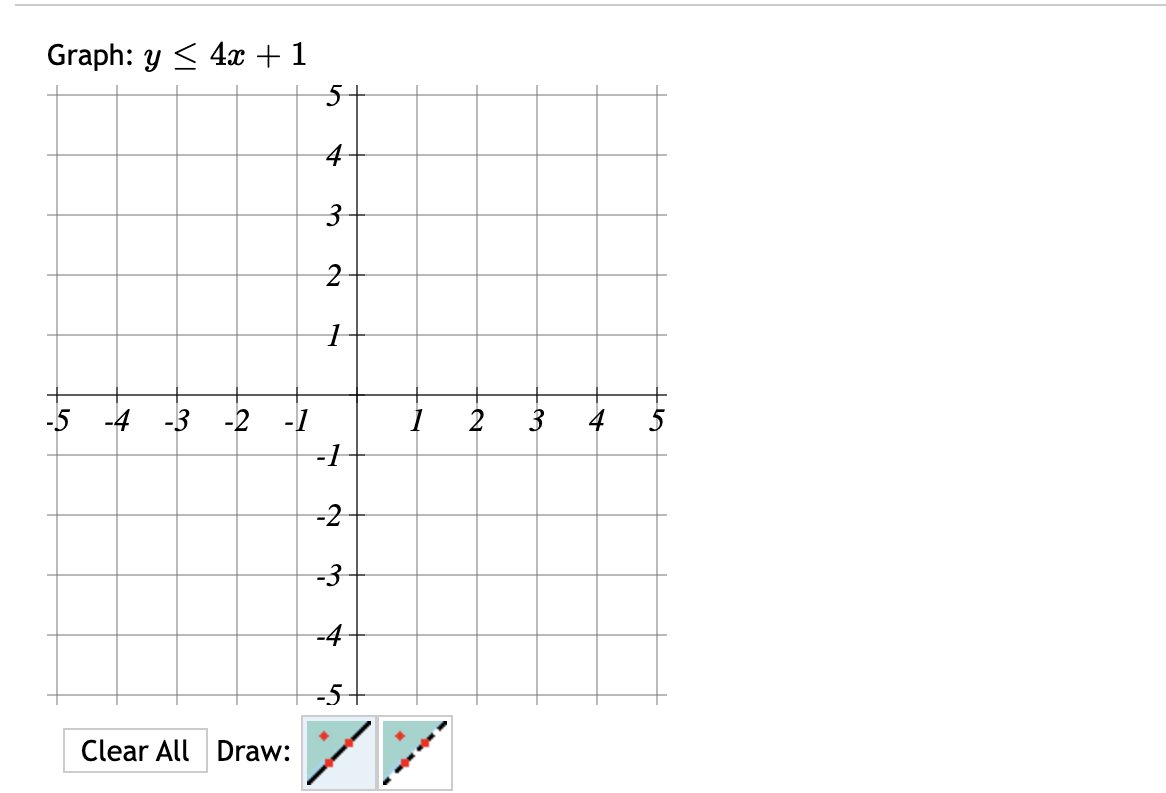
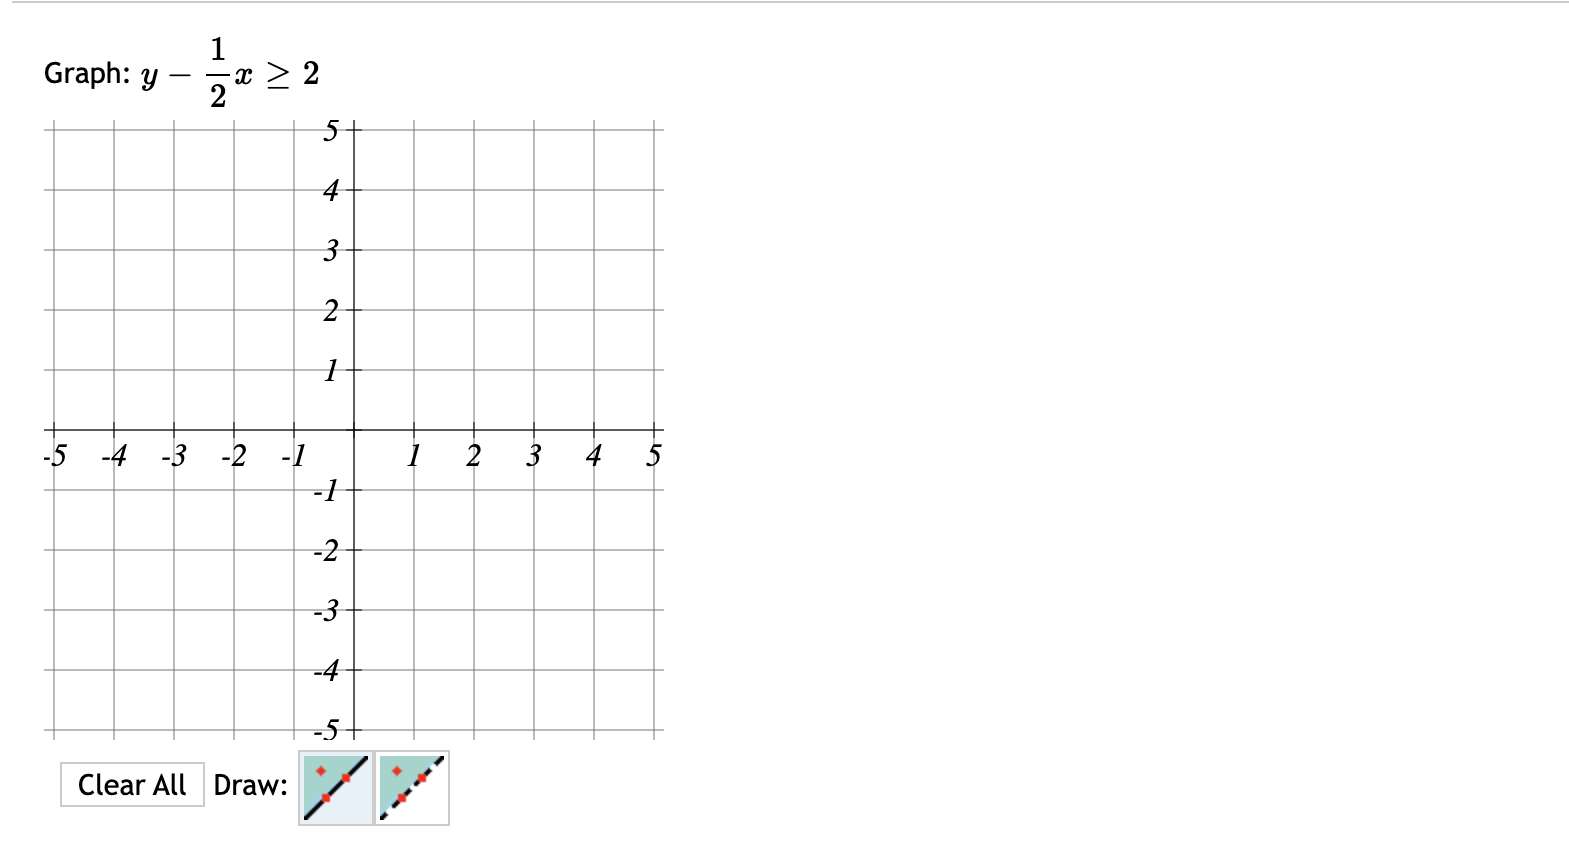
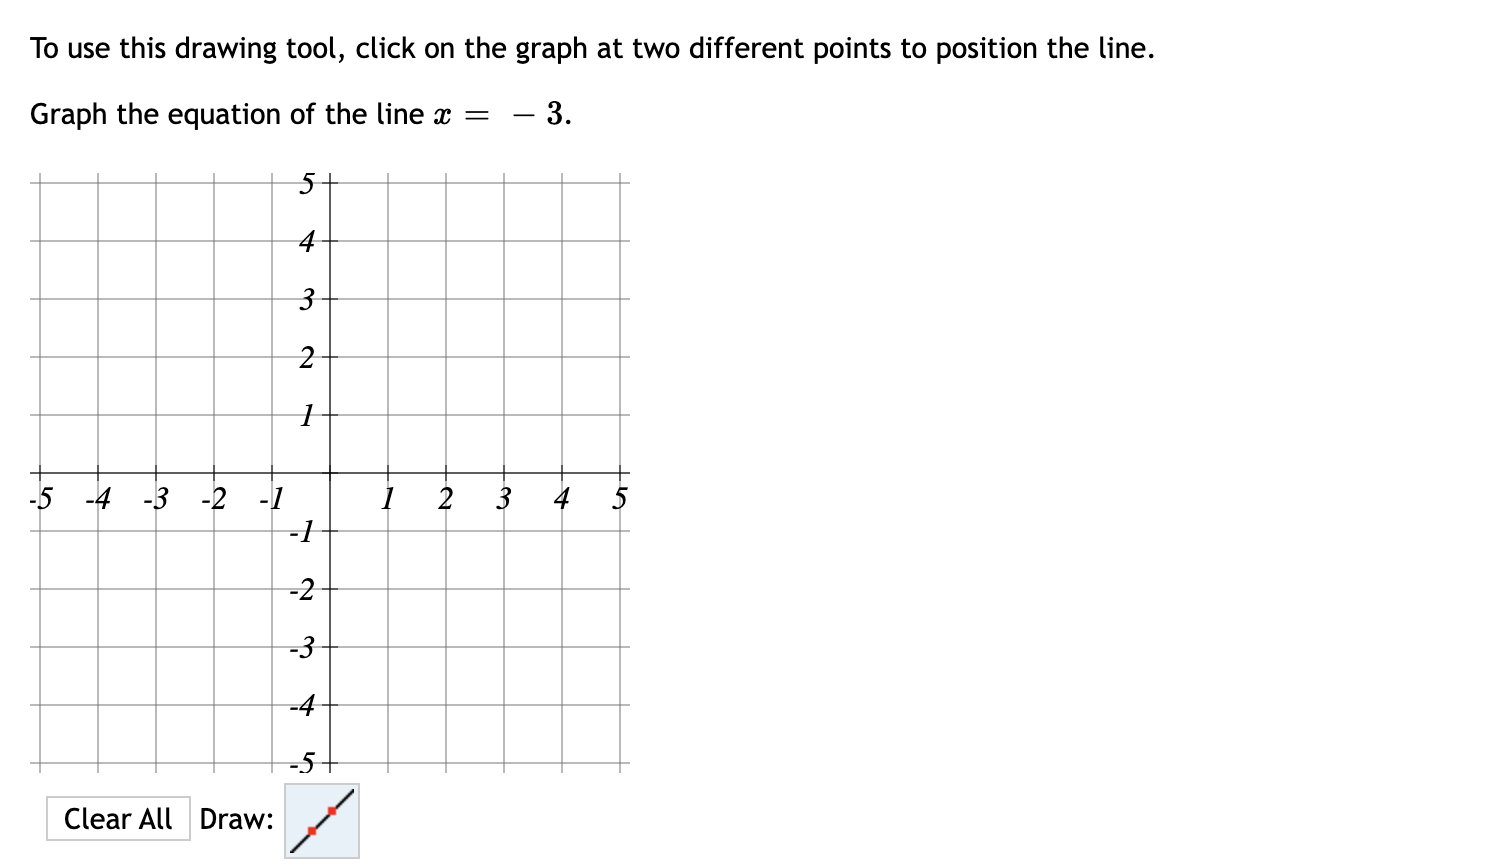
Graphing Linear Equations and Inequalities Please answer them clear explanation and understanding 1 Fill in the t-table below for the equation. Then graph the line

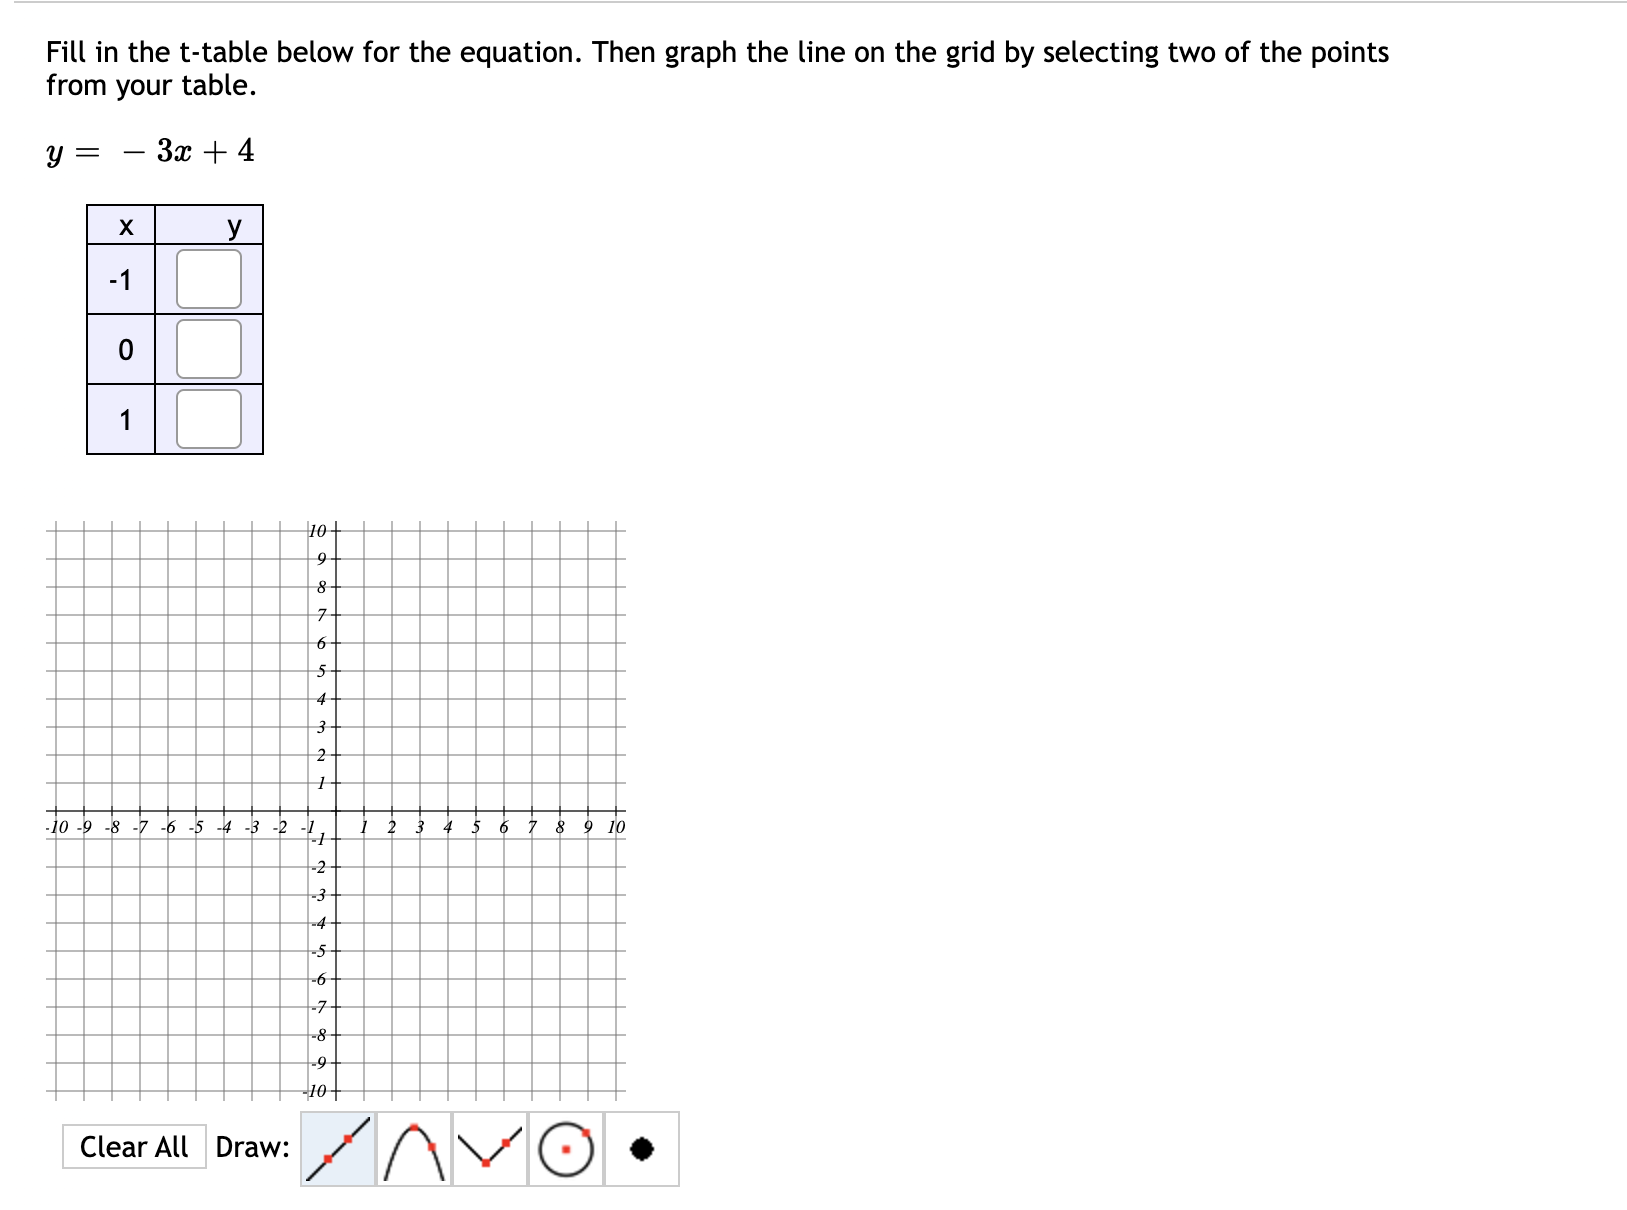
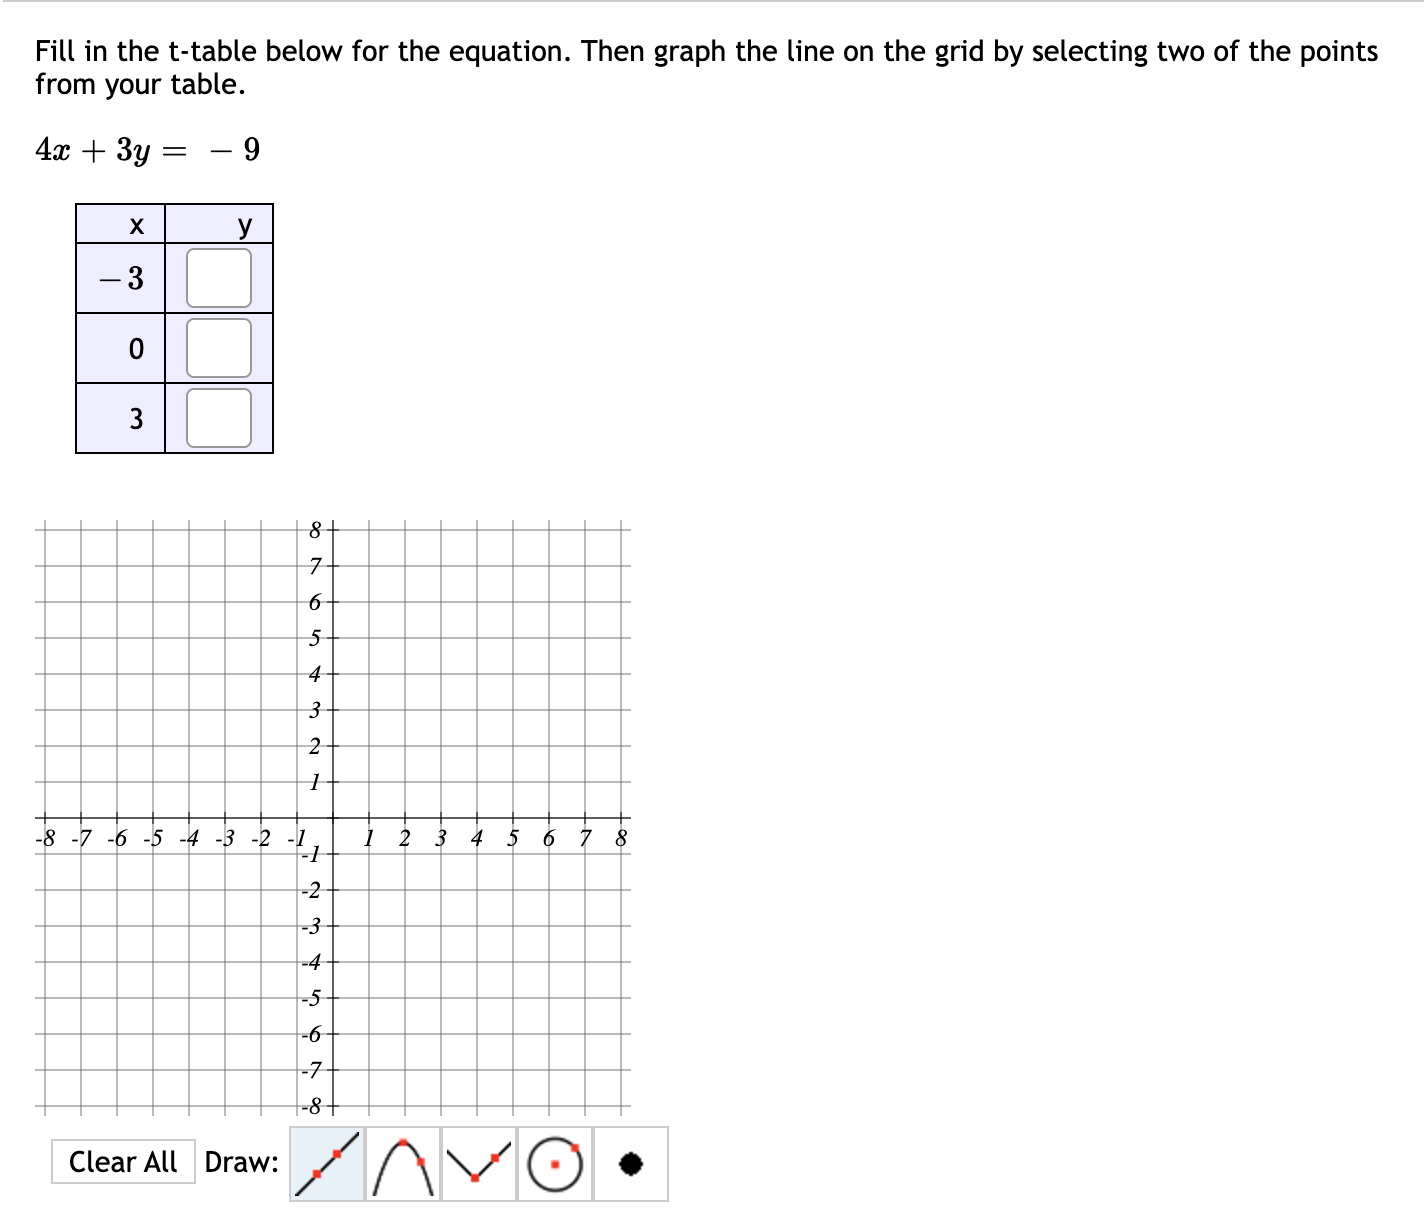


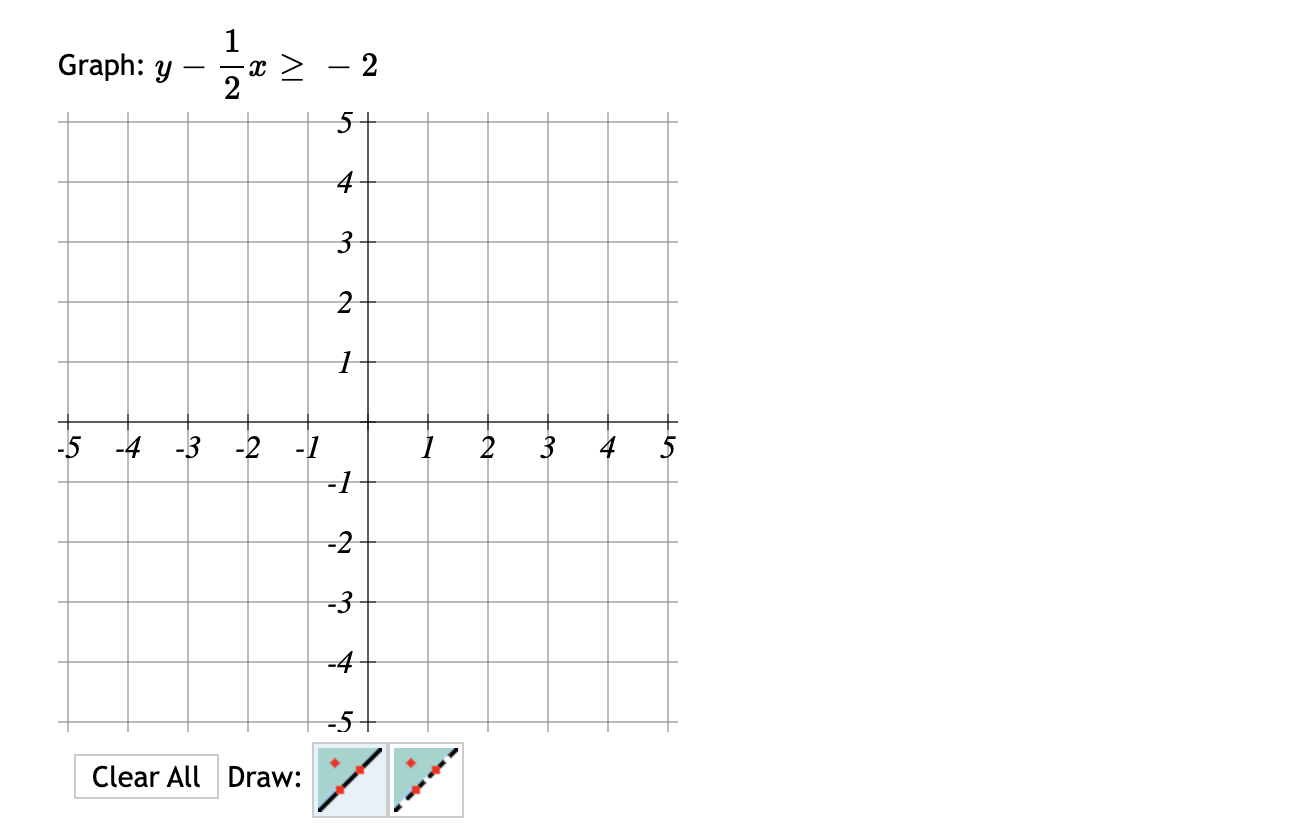


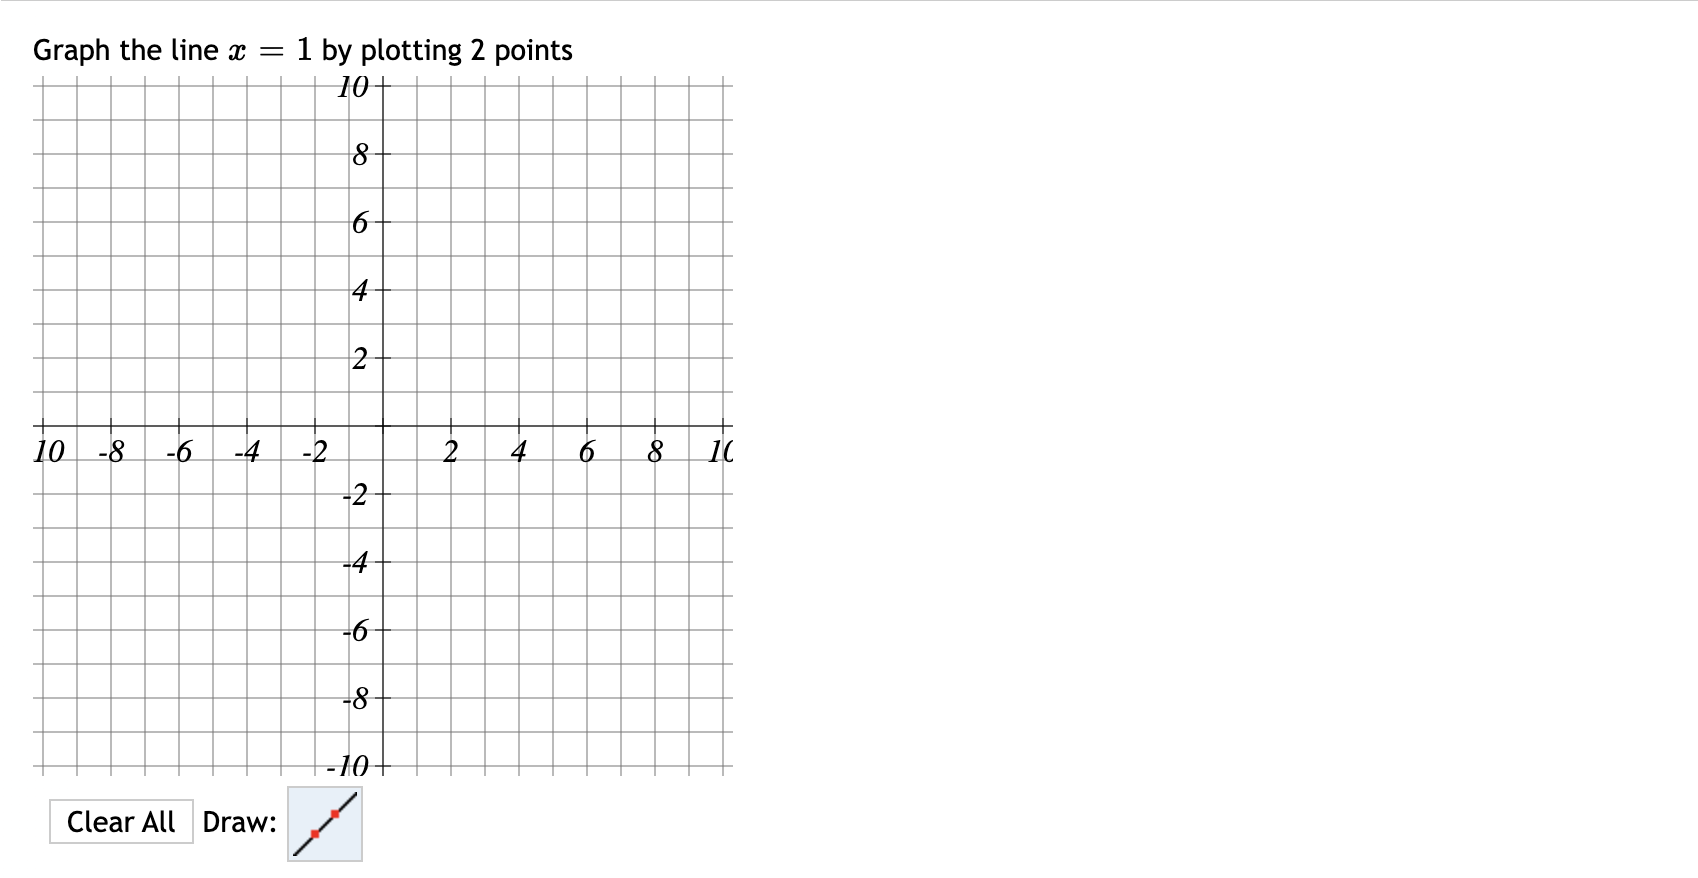
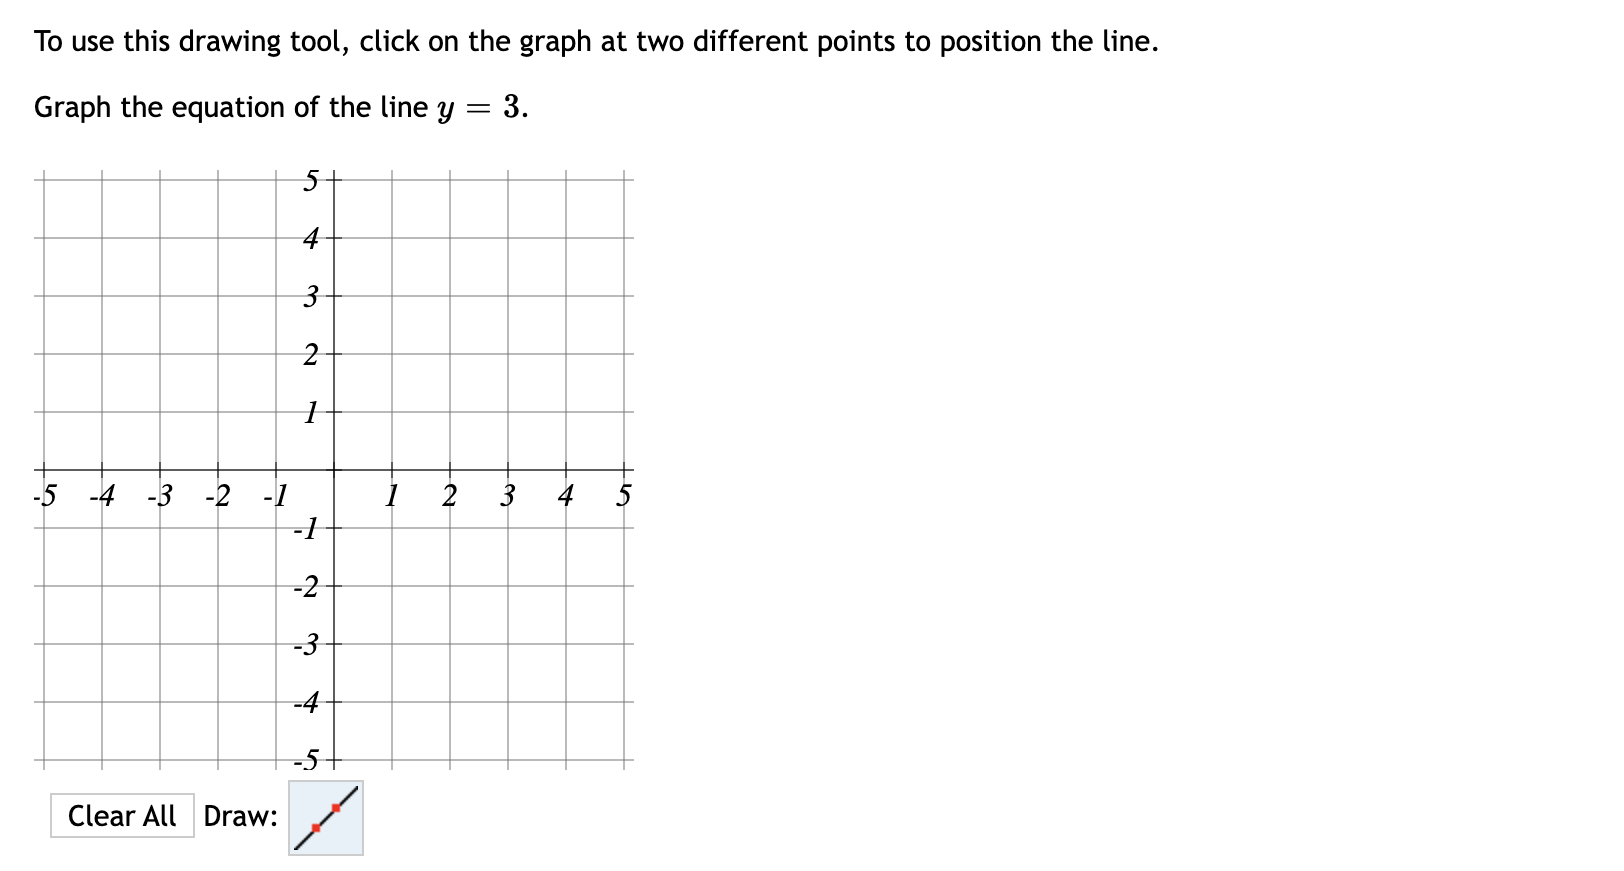
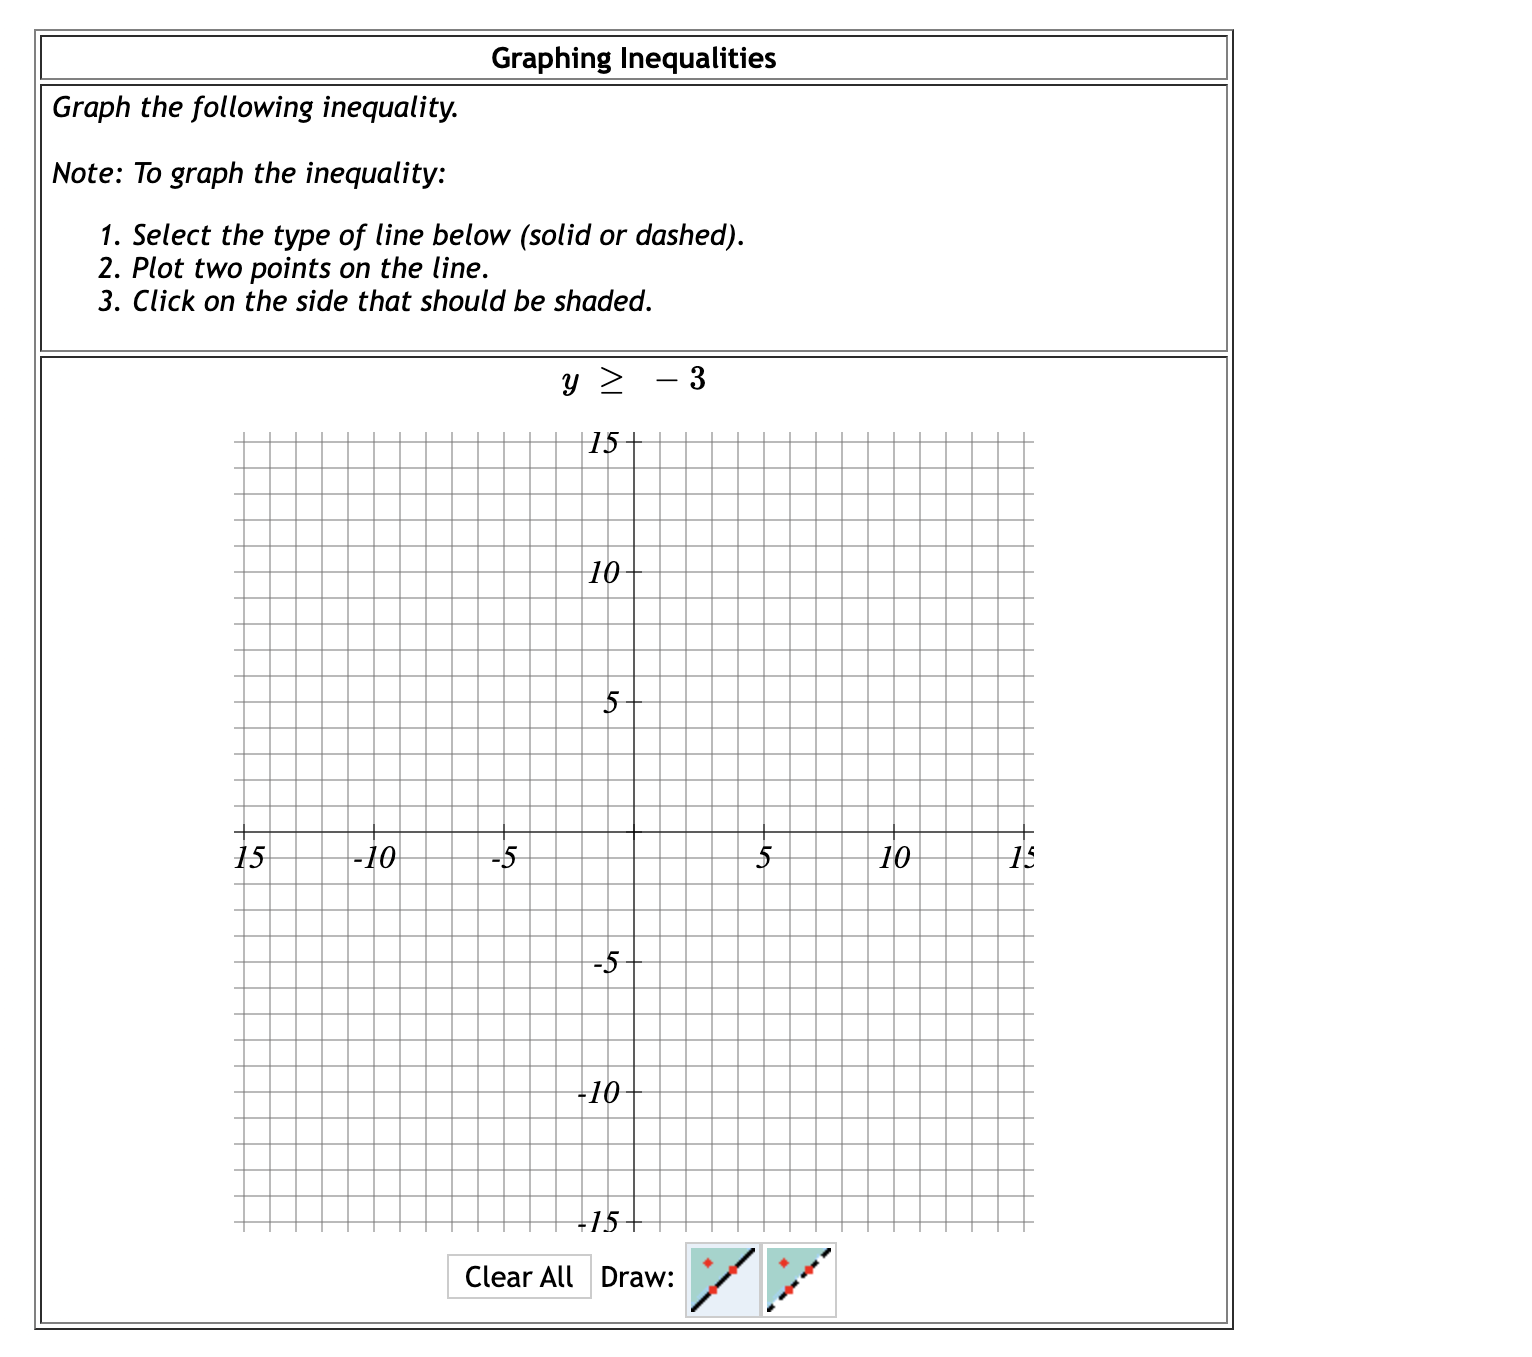
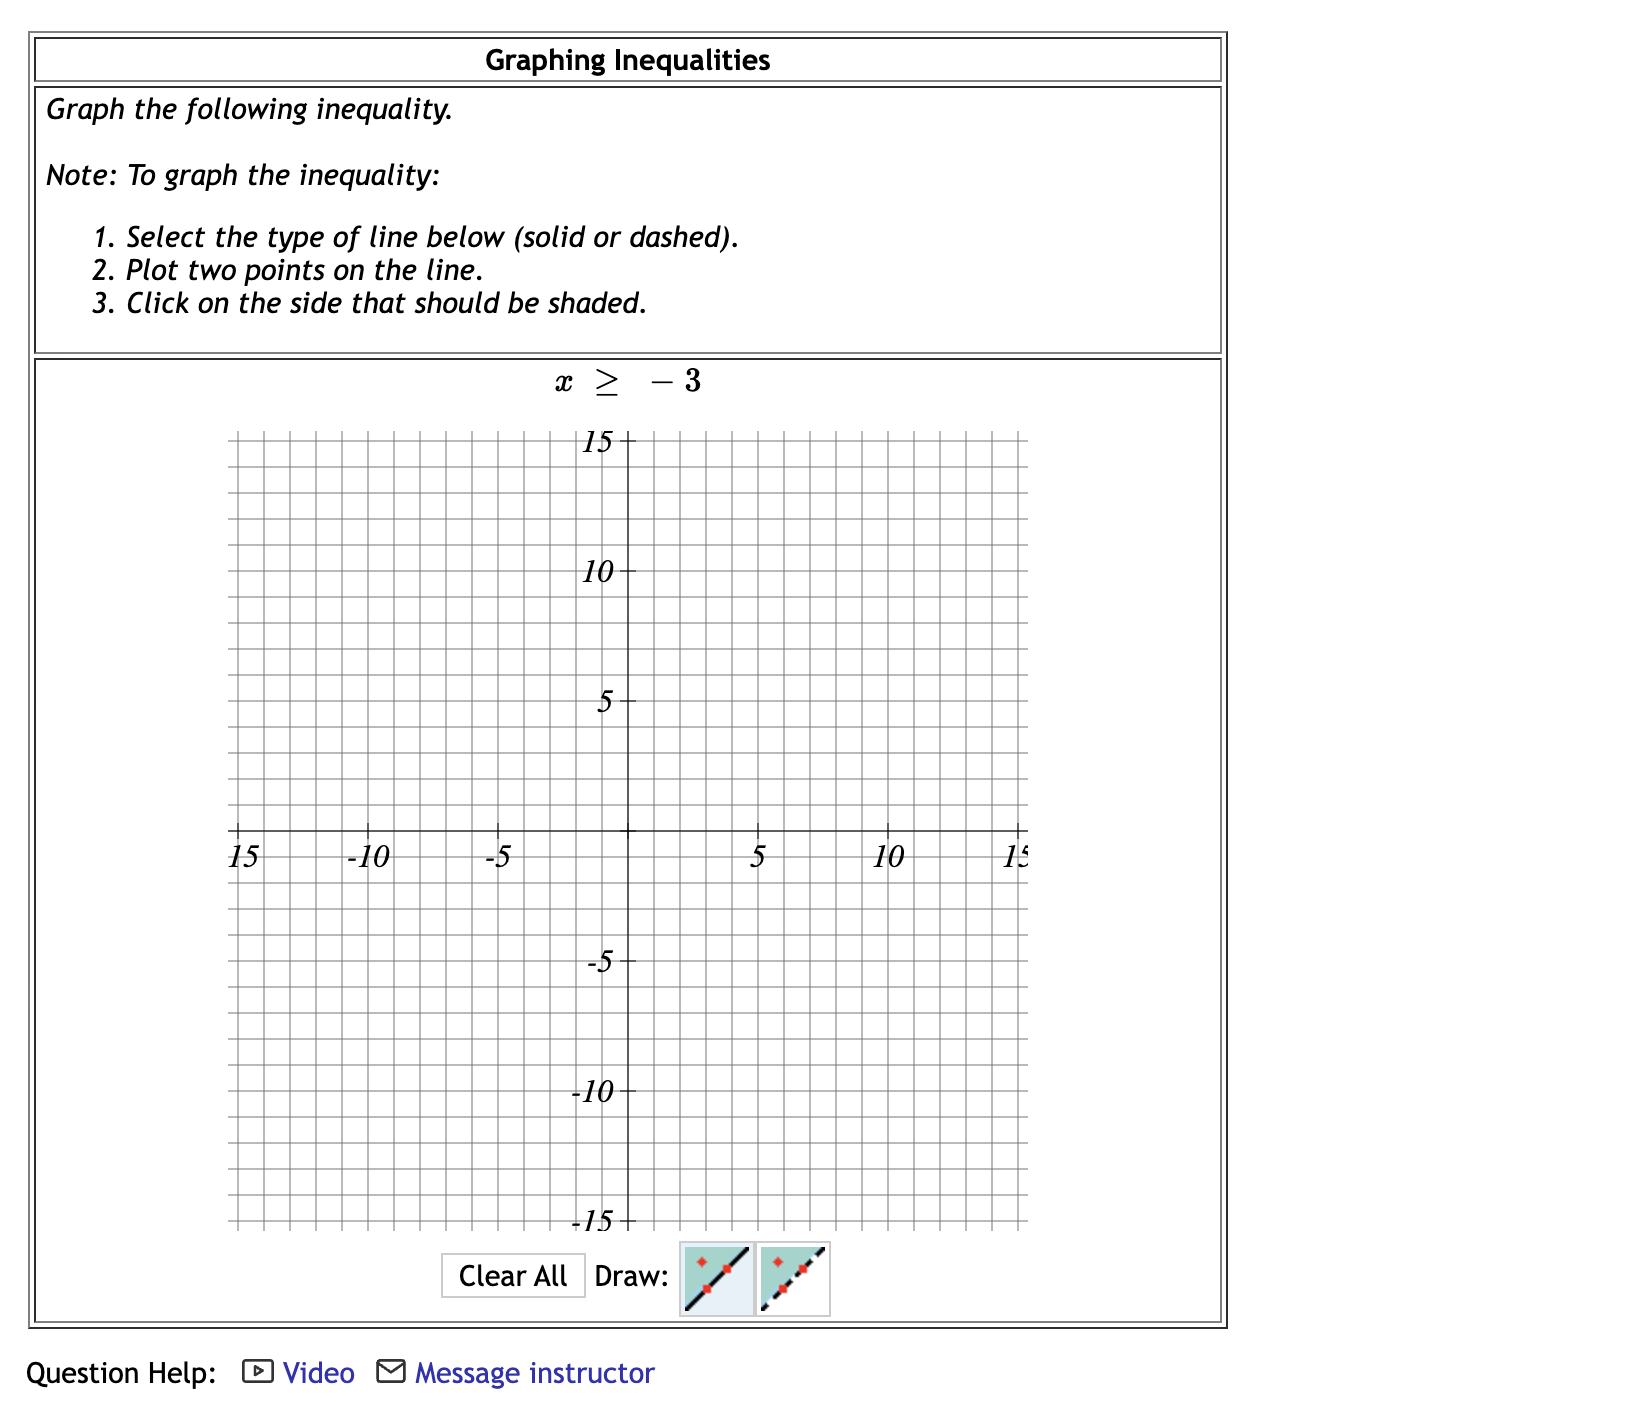
Graphing Linear Equations and Inequalities
Please answer them clear explanation and understanding
1


Step by Step Solution
There are 3 Steps involved in it
Step: 1

Get Instant Access to Expert-Tailored Solutions
See step-by-step solutions with expert insights and AI powered tools for academic success
Step: 2

Step: 3
Ace Your Homework with AI
Get the answers you need in no time with our AI-driven, step-by-step assistance
Get Started
Non-metrisable Manifolds
Authors: David Gauld
1st Edition
9812872574, 9789812872579