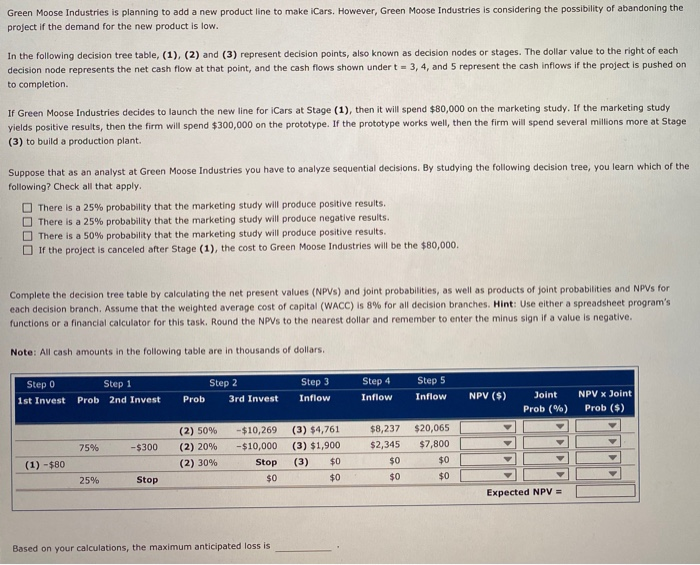
Green Moose Industries is planning to add a new product line to make iCars. However, Green Moose Industries is considering the possibility of abandoning the project if the demand for the new product is low. In the following decision tree table, (1), (2) and (3) represent decision points, also known as decision nodes or stages. The dollar value to the right of each decision node represents the net cash flow at that point, and the cash flows shown under t - 3, 4, and 5 represent the cash inflows if the project is pushed on to completion If Green Moose Industries decides to launch the new line for Cars at Stage (1), then it will spend $80,000 on the marketing study. If the marketing study yields positive results, then the firm will spend $300,000 on the prototype. If the prototype works well, then the firm will spend several millions more at Stage (3) to build a production plant. Suppose that as an analyst at Green Moose Industries you have to analyze sequential decisions. By studying the following decision tree, you learn which of the following? Check all that apply. There is a 25% probability that the marketing study will produce positive results. There is a 25% probability that the marketing study will produce negative results. There is a 50% probability that the marketing study will produce positive results. If the project is canceled after Stage (1), the cost to Green Moose Industries will be the $80,000, Complete the decision tree table by calculating the net present values (NPVS) and joint probabilities, as well as products of joint probabilities and NPVs for each decision branch. Assume that the weighted average cost of capital (WACC) is 8% for all decision branches. Hint: Use either a spreadsheet program's functions or a financial calculator for this task. Round the NPVs to the nearest dollar and remember to enter the minus sign if a value is negative. Note: All cash amounts in the following table are in thousands of dollars. Step 2 Step O 1st Invest Step 1 Prob 2nd Invest Step 3 Inflow Step 4 Inflow Step 5 Inflow Prob 3rd Invest NPV ($) Joint Prob (%) NPV x Joint Prob ($) 75% -$300 (2) 50% (2) 20% (2) 30% -$10,269 - $10,000 Stop $0 (3) $4,761 (3) $1,900 (3) $0 $0 $8,237 $2,345 $0 $0 $20,065 $7,800 $0 $0 (1) -$80 25% Stop Expected NPV = Based on your calculations, the maximum anticipated loss is Green Moose Industries is planning to add a new product line to make iCars. However, Green Moose Industries is considering the possibility of abandoning the project if the demand for the new product is low. In the following decision tree table, (1), (2) and (3) represent decision points, also known as decision nodes or stages. The dollar value to the right of each decision node represents the net cash flow at that point, and the cash flows shown under t - 3, 4, and 5 represent the cash inflows if the project is pushed on to completion If Green Moose Industries decides to launch the new line for Cars at Stage (1), then it will spend $80,000 on the marketing study. If the marketing study yields positive results, then the firm will spend $300,000 on the prototype. If the prototype works well, then the firm will spend several millions more at Stage (3) to build a production plant. Suppose that as an analyst at Green Moose Industries you have to analyze sequential decisions. By studying the following decision tree, you learn which of the following? Check all that apply. There is a 25% probability that the marketing study will produce positive results. There is a 25% probability that the marketing study will produce negative results. There is a 50% probability that the marketing study will produce positive results. If the project is canceled after Stage (1), the cost to Green Moose Industries will be the $80,000, Complete the decision tree table by calculating the net present values (NPVS) and joint probabilities, as well as products of joint probabilities and NPVs for each decision branch. Assume that the weighted average cost of capital (WACC) is 8% for all decision branches. Hint: Use either a spreadsheet program's functions or a financial calculator for this task. Round the NPVs to the nearest dollar and remember to enter the minus sign if a value is negative. Note: All cash amounts in the following table are in thousands of dollars. Step 2 Step O 1st Invest Step 1 Prob 2nd Invest Step 3 Inflow Step 4 Inflow Step 5 Inflow Prob 3rd Invest NPV ($) Joint Prob (%) NPV x Joint Prob ($) 75% -$300 (2) 50% (2) 20% (2) 30% -$10,269 - $10,000 Stop $0 (3) $4,761 (3) $1,900 (3) $0 $0 $8,237 $2,345 $0 $0 $20,065 $7,800 $0 $0 (1) -$80 25% Stop Expected NPV = Based on your calculations, the maximum anticipated loss is