Question
Green Thumb estimates that discounting a Red Tomato tool from $31 to $30 (a $1 discount) in any period results in the period demand increasing
Green Thumb estimates that discounting a Red Tomato tool from $31 to $30 (a $1 discount) in any period results in the period demand increasing by 10 percent because of increased consumption or substitution. Further, 20 percent of each of the two following months' demand is moved forward. Management would like to determine whether it is more effective to offer the discount in January or April.
Now you are asked to analyze these two possibilities and compare results and show that which option is more reasonable.
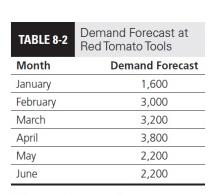
Red Tomato Tools, a small manufacturer of gardening equipment with manufacturing facilities in Mexico. Red Tomato's products are sold through retailers in the United States. Red Tomato's operations consist of the assembly of purchased parts into a multipurpose gardening tool. Because of the limited equipment and space required for its assembly operations, Red Tomato's capacity is determined mainly by the size of its workforce. For this example, we use a six-month time period because this is a long enough time horizon to illustrate many of the main points of aggregate planning. The demand for Red Tomato's gardening tools from consumers is highly seasonal, peaking in the spring as people plant their gardens. This seasonal demand ripples up the supply chain from the retailer to Red Tomato, the manufacturer. The options Red Tomato has for handling the seasonality are adding workers during the peak season, subcontracting out some of the work, building up inventory during the slow months, or building up a backlog of orders that will be delivered late to customers. Red Tomato's vice president of supply chain starts with the first task-building a demand forecast. Although Red Tomato could attempt to forecast this demand itself, a much more accurate forecast comes from a collaborative process used by both Red Tomato and its retailers to produce the forecast shown in Table 8-2.

Red Tomato Tools Demand Forecast at Month Demand Forecast January 1,600 February 3,000 March 3,200 April 3,800 May 2,200 June 2,200 Green Thumb Gardens is a large retail chain that has signed an exclusive contract to sell products made by Red Tomato Tools. Demand for garden tools peaks in the spring months of March and April, as gardeners prepare to begin planting. In planning, the goal of both firms should be to maximize supply chain profits, because this outcome leaves them more money to share. For profit maximization to take place, Red Tomato and Green Thumb need to devise a collabor and, just as important, determine a way to split the supply chain profits. Determining how thes profits will be allocated to different members of the supply chain is key to successful collaboration.

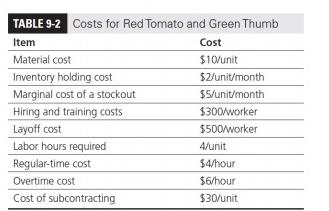
Each tool has a retail price of $31. Red Tomato ships assembled tools to Green Thumb, where all inventory is held. Green Thumb has a starting inventory in January of 1,000 tools. At the beginning of January, Red Tomato has a workforce of 80 employees at its manufacturing facility in Mexico. There are 20 working days in each month, and Red Tomato workers carn the equivalent of $4 per hour. Each employee works eight hours on normal time and the rest on overtime. Because the Red Tomato operation consists mostly of hand assembly, the capacity of the production employee works more than 10 hours of overtime per month. The various costs are shown in Table 9-2. operation is determined primarily by the total labor hours worked (i.e., it is not limited by machine capacity). No There are no limits on subcontracting, inventories, and stockouts. All stockouts are backlogged and supplied from the following month's production. Inventory costs are incurred on the ending inventory in each month. The companies' goal is to obtain the optimal aggregate plan that leaves at least 500 units of inventory at the end of June (i.c., no stockouts at the end of June and at least 500 units in inventory).
Demand Forecast at Red Tomato Tools TABLE 8-2 Month Demand Forecast January 1,600 February 3,000 March 3,200 April 3,800 May 2,200 June 2,200
Step by Step Solution
There are 3 Steps involved in it
Step: 1
Strategy 1 a Total cost of plan 39112000 b Maximum inventory 1780 c Largest ...
Get Instant Access to Expert-Tailored Solutions
See step-by-step solutions with expert insights and AI powered tools for academic success
Step: 2

Step: 3

Ace Your Homework with AI
Get the answers you need in no time with our AI-driven, step-by-step assistance
Get Started


