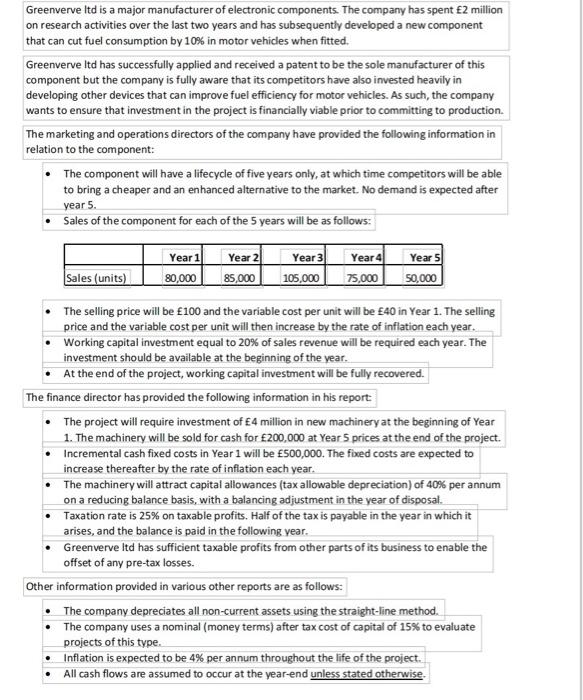
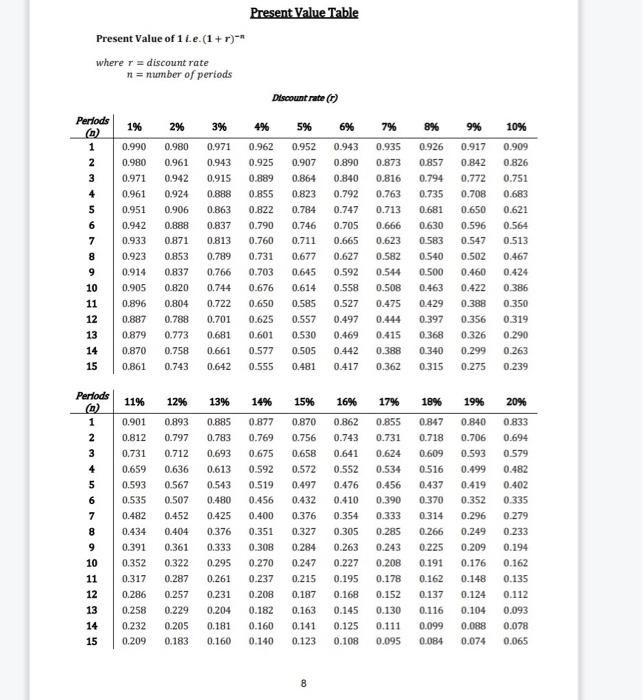
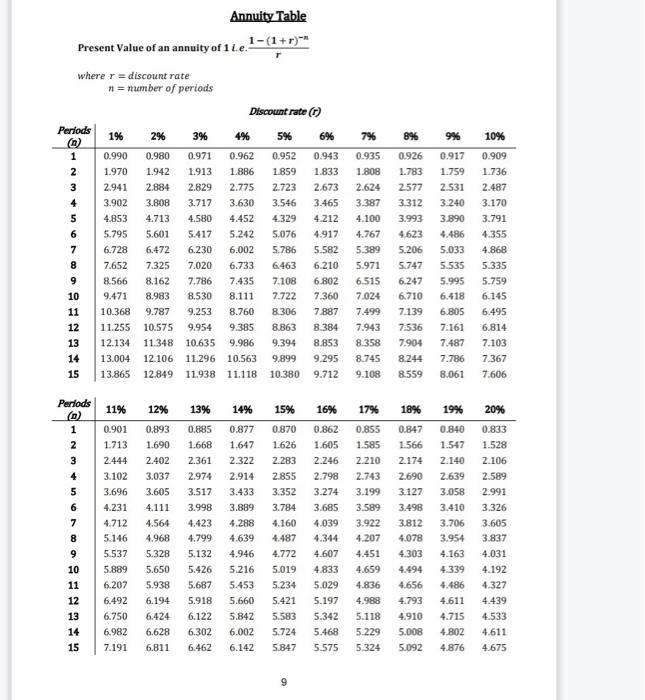
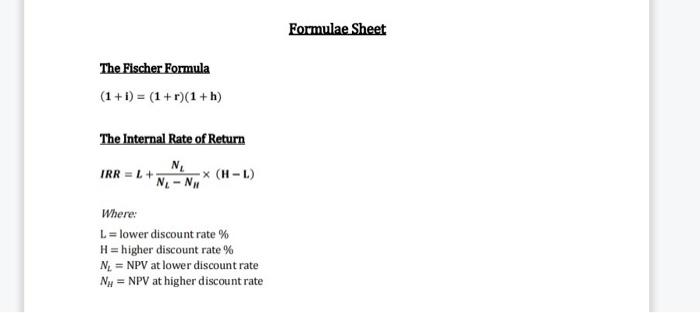
Greenverve Itd is a major manufacturer of electronic components. The company has spent 2 million on research activities over the last two years and has subsequently developed a new component that can cut fuel consumption by 10% in motor vehicles when fitted. Greenverve ltd has successfully applied and received a patent to be the sole manufacturer of this component but the company is fully aware that its competitors have also invested heavily in developing other devices that can improve fuel efficiency for motor vehicles. As such, the company wants to ensure that investment in the project is financially viable prior to committing to production. The marketing and operations directors of the company have provided the following information in relation to the component: The component will have a lifecycle of five years only, at which time competitors will be able to bring a cheaper and an enhanced alternative to the market. No demand is expected after year 5. Sales of the component for each of the 5 years will be as follows: Year 1! Year 2 Year 3 Year 4 Year 5 Sales (units) 80,000 85,000 105,000 75,000 50,000 The selling price will be 100 and the variable cost per unit will be 40 in Year 1. The selling price and the variable cost per unit will then increase by the rate of inflation each year. Working capital investment equal to 20% of sales revenue will be required each year. The investment should be available at the beginning of the year. At the end of the project, working capital investment will be fully recovered. The finance director has provided the following information in his report The project will require investment of 4 million in new machinery at the beginning of Year 1. The machinery will be sold for cash for 200,000 at Year 5 prices at the end of the project. Incremental cash fixed costs in Year 1 will be 500,000. The fixed costs are expected to increase thereafter by the rate of inflation each year. The machinery will attract capital allowances (tax allowable depreciation) of 40% per annum on a reducing balance basis, with a balancing adjustment in the year of disposal. Taxation rate is 25% on taxable profits. Half of the tax is payable in the year in which it arises, and the balance is paid in the following year. Greenverve ltd has sufficient taxable profits from other parts of its business to enable the offset of any pre-tax losses. Other information provided in various other reports are as follows: The company depreciates all non-current assets using the straight-line method. The company uses a nominal (money terms) after tax cost of capital of 15% to evaluate projects of this type. Inflation is expected to be 4% per annum throughout the life of the project. All cash flows are assumed to occur at the year-end unless stated otherwise Required (a) Evaluate whether Greenverve ltd should go ahead with the project. You should use net present value as the basis of your evaluation. (b) Using relevant examples, critically discuss other key factors that Greenverve ltd should consider before making a final decision on the project. (maximum of 500 words). Present Value Table Present Value of 1.e. (1+r)-* where r = discount rate n = number of periods Discount rate (1) 1% 2% 3% 4% 5% 696 7% 8% 9% 10% 0.990 0.980 0.971 0.961 0.951 0.971 0.943 0.915 0.888 0.863 0.952 0.907 0.864 0.823 0.784 Periods O 1 2 3 4 5 6 7 8 9 10 11 12 13 14 15 0.942 0.933 0.923 0.980 0.961 0.942 0.924 0.906 0.888 0.871 0.853 0.837 0.820 0.804 0.788 0.773 0.758 0.743 0.837 0.813 0.789 0.962 0.925 0.889 0.855 0.822 0.790 0.760 0.731 0.703 0.676 0.650 0.625 0.601 0.577 0.555 0.746 0.711 0.677 0.645 0.614 0.585 0.943 0.890 0.840 0.792 0.747 0.705 0.665 0.627 0.592 0.558 0.527 0.497 0.469 0.442 0.417 0.935 0.873 0.816 0.763 0.713 0.666 0.623 0.582 0.544 0.508 0.475 0.444 0.415 0.388 0.362 0.926 0.857 0.794 0.735 0.681 0.630 0.583 0.540 0.500 0.463 0.429 0.397 0.368 0.340 0.315 0.917 0.842 0.772 0.708 0.650 0.596 0.547 0.502 0.460 0.422 0.388 0.356 0.326 0.299 0.275 0.909 0.826 0.751 0.683 0.621 0.564 0.513 0.467 0.424 0.386 0.350 0.319 0.290 0.263 0.239 0.914 0.905 0.896 0.887 0.879 0.870 0.861 0.766 0.744 0.722 0.701 0.681 0.661 0.642 0.557 0.530 0.505 0.481 11% 12% 13% 14% 15% 16% 17% 18% 19% Periods O 1 2 3 4 5 6 7 8 9 10 11 12 13 14 15 0.901 0.812 0.731 0.659 0.593 0.535 0.482 0.434 0.391 0.352 0.317 0.286 0.258 0.232 0.209 0.893 0.797 0.712 0.636 0.567 0.507 0.452 0.404 0.361 0.322 0.287 0.257 0.229 0.205 0.183 0.885 0.783 0.693 0.613 0.543 0.480 0.425 0.376 0.333 0.295 0.261 0.231 0.204 0.181 0.160 0.877 0.769 0.675 0.592 0.519 0.456 0.400 0.351 0.308 0.270 0.237 0.208 0.182 0.160 0.140 0.870 0.756 0.658 0.572 0.497 0.432 0.376 0.327 0.284 0.247 0.215 0.187 0.163 0.141 0.123 0.862 0.743 0.641 0.552 0.476 0.410 0.354 0.305 0.263 0.227 0.195 0.168 0.145 0.125 0.108 0.855 0.731 0.624 0.534 0.456 0.390 0.333 0.285 0.243 0.208 0.178 0.152 0.130 0.111 0.095 0.847 0.718 0.609 0.516 0.437 0.370 0.314 0.266 0.225 0.191 0.162 0.137 0.116 0.099 0.084 0.840 0.706 0.593 0.499 0.419 0.352 0.296 0.249 0.209 0.176 0.148 0.124 0.104 0.088 0.074 20% 0.833 0.694 0.579 0.482 0.402 0.335 0.279 0.233 0.194 0.162 0.135 0.112 0.093 0.078 0.065 1% 9% 10% Annuity Table Present Value of an annuity of 11.e. 1-(1+r) where r = discount rate n = number of periods Discount rate (1) Periods 2% 3% 4% 5% O 6% 1 0.990 0.980 0.971 0.962 0.952 0.943 2 1.970 1.942 1.913 1.886 1859 1.833 3 2941 2.884 2.829 2.775 2.723 2.673 4 3.902 3.808 3.717 3.630 3.546 3.465 5 4.853 4.713 4.580 4.452 4.329 4.212 6 5.795 5.601 5.417 5.242 5.076 4.917 7 6.728 6.472 6.230 6.002 5.786 5.582 8 7.652 7.325 7,020 6.733 6.463 6.210 9 8.566 8.162 7.786 7.435 7.108 6.802 10 9.471 8.983 8.530 8.111 7.722 7.360 11 10.368 9.787 9.253 8.760 8.306 7887 12 11.255 10.575 9.954 9.385 8.863 8.384 13 12.134 11.348 10.635 9.986 9.394 8.853 14 13.004 12.106 11296 10.563 9.899 9.295 15 13.865 12.849 11.938 11.118 10.380 9.712 7% 0.935 1.808 2.624 3.387 4.100 4.767 5.389 5.971 6.515 7.024 7.499 7.943 8.358 8.745 9.108 8% 0.926 1.783 2577 3.312 3.993 4.623 5.206 5.747 6.247 6.710 7.139 7.536 7.904 8.244 8.559 0.917 1.759 2.531 3.240 3.890 4.486 5.033 5.535 5.995 6.418 6.805 7.161 7.487 7.786 8.061 0.909 1.736 2.487 3.170 3.791 4.355 4.868 5.335 5.759 6.145 6.495 6.814 7.103 7.367 7.606 11% 12% 13% 14% 15% 16% 17% 18% 19% 20% 0.855 0.847 1.566 1.585 Periods 0 1 2 3 4 5 6 7 8 9 10 11 12 13 14 15 0.901 1.713 2.444 3.102 3.696 4.231 4.712 5.146 5.537 5.889 6.207 6.492 6.750 6.982 7.191 0.893 1.690 2.402 3.037 3.605 4.111 4.564 4.968 5.328 5.650 5.938 6.194 6.424 6.628 6.811 0.885 1.668 2.361 2.974 3.517 3.998 4.423 4.799 5.132 5.426 5.687 5.918 6.122 6.302 6.462 0.877 1.647 2.322 2.914 3.433 3.889 4.288 4.639 4.946 5.216 5.453 5.660 5.842 6.002 6.142 0.870 1.626 2.283 2.855 3.352 3.784 4.160 4.487 4.772 5.019 5.234 5.421 5.583 5.724 5.847 0.862 1.605 2.246 2.798 3.274 3.685 4.039 4.344 4.607 4.833 5.029 5.197 5.342 5.468 5.575 2.210 2.743 3.199 3.589 3.922 4.207 4.451 4.659 4.836 4.988 5.118 5.229 5.324 2.174 2.690 3.127 3.498 3.812 4.078 4.303 4.494 4.656 4.793 4.910 5.000 5.092 0.840 1.547 2.140 2.639 3.058 3.410 3.706 3.954 4.163 4.339 4.486 4.611 4.715 4.802 4.876 0.833 1.528 2.106 2.589 2.991 3.326 3.605 3.837 4.031 4.192 4.327 4.439 4.533 4.611 4.675 Formulae Sheet The Fischer Formula (1 +1) = (1+r)(1+h) The Internal Rate of Return N TRR = L + -X (H-L) N-N Where: L = lower discount rate % H = higher discount rate % N = NPV at lower discount rate Nu = NPV at higher discount rate
