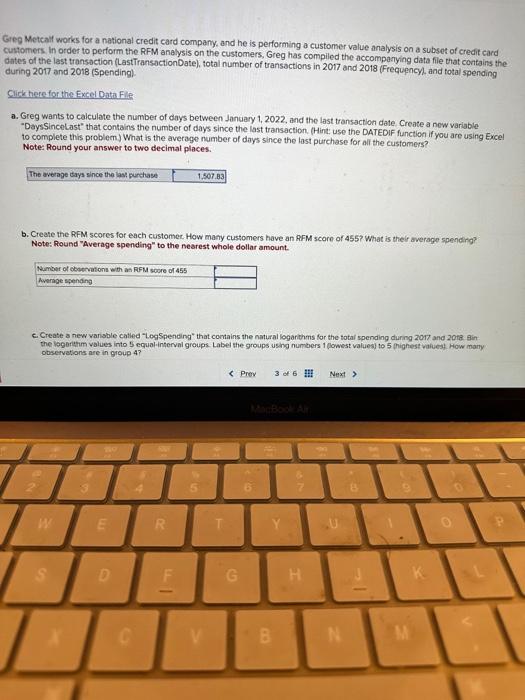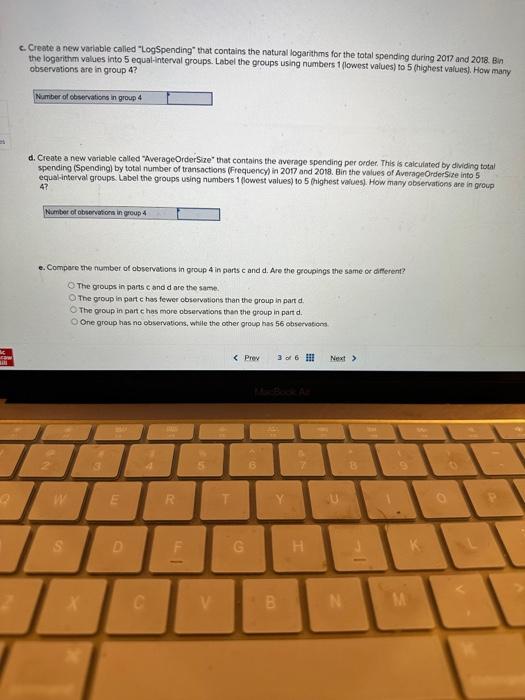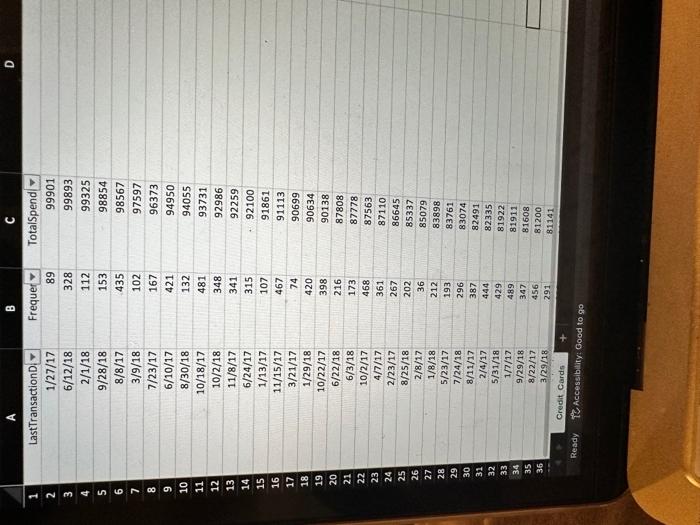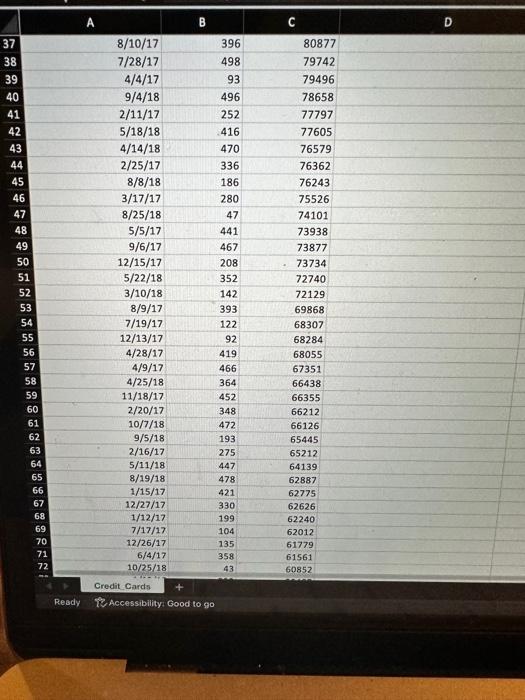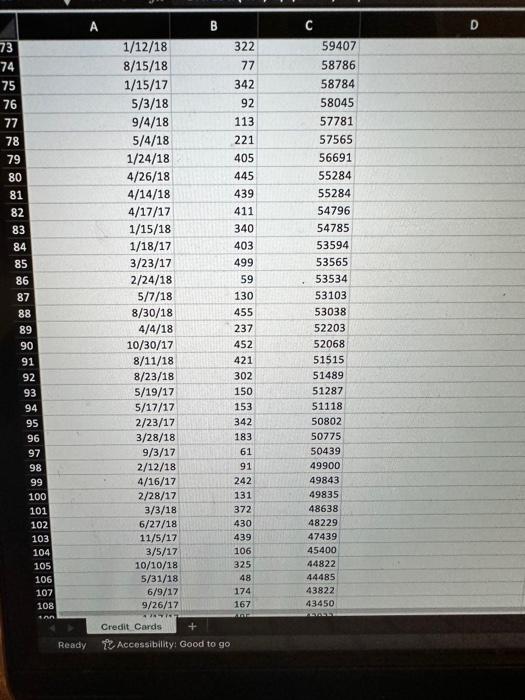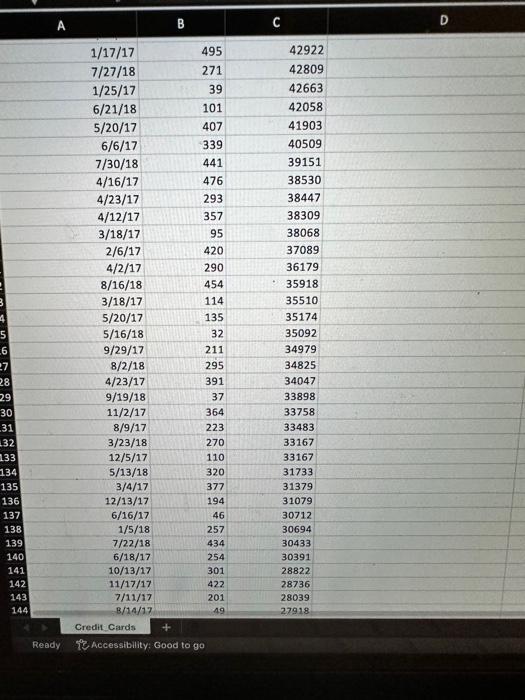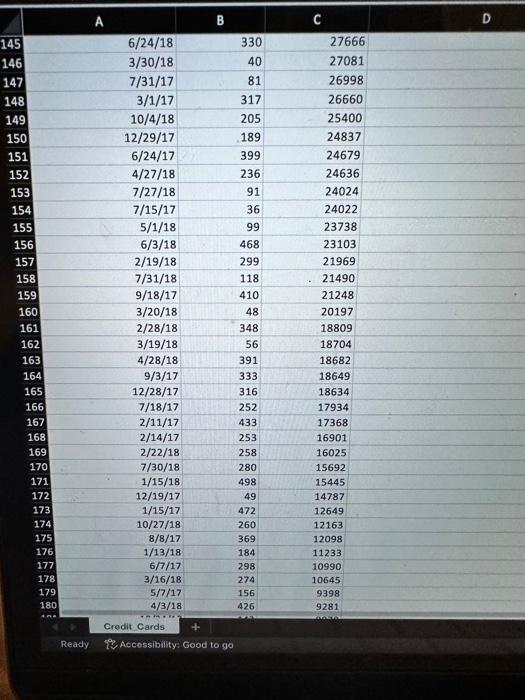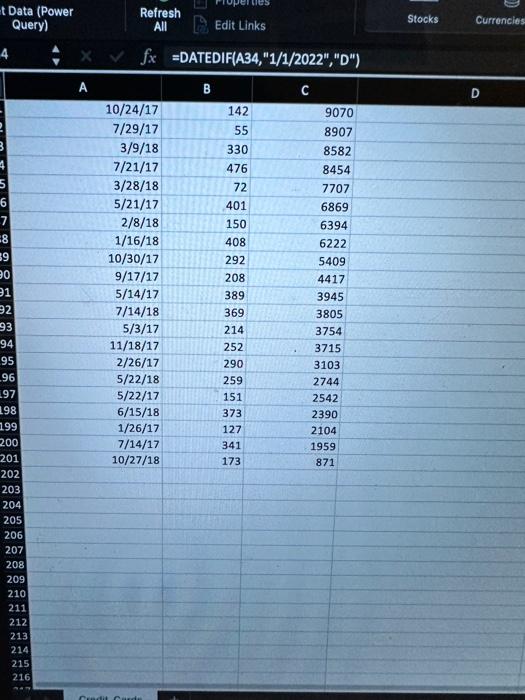
Greg Metcalf works for a national credit card company, and he is performing a customer value analysis on a subset of credit card customers. In order to perform the RFM analysis on the customers, Greg has compiled the accompanying data file that contains the dates of the last transaction (LastiransactionDate), total number of transactions in 2017 and 2018 (Frequency, and total spending during 2017 and 2018 (Spending). Click here for the Excel Data Flle a. Greg wants to calculate the number of days between January 1, 2022, and the last transaction date. Create a now variable "Days Sincelast" that contains the number of days since the last transaction. (Hint: use the DATEDIF function if you are using Excel to complete this problem) What is the average number of days since the last purchase for alf the customers? Note: Round your answer to two decimat places. b. Create the RFM scores for each customec. How many customers have an RFM score of 455 ? What is their average spending? Note: Round "Average spending" to the nearest whole dollar amount. c. Create a new varisble catled "LogSpending* that contains the natural logarithms for the total spending during 2017 and 2018 . gin the logorithm values into 5 equal interval groups. Labed the groups using numbers 1 (lowest values) to 5 (highest vaiues). How many observations are in group 4? c. Create a new variable called "LogSpending" that contains the natural logarithms for the total spending during 2017 and 2018 . Bin the logarithm values into 5 equal-interval groups. Label the groups using numbers 1 (lowest values) to 5 (highest values). Haw many observations are in group 4 ? d. Create a new variable called "AverageOrderSize" that contains the averege spending per order. This is calculated by dividing total spending (Spending) by total number of transactions (Frequency) in 2017 and 2018 . Bin the values of AvorageOrderSize into 5 equalinterval groups. Label the groups using numbers 1 (lowest values) to 5 (highest values). How many observations are in group 4 ? e. Compare the number of observations in group 4 in parts c and d. Are the groupings the same or different? The groups in pans c and d are the same. The group in part c has fewer coservotions than the group in part d. The group in part chas more observalions thun the group in part d. One group has ne observations, whille the other group has 56 observatons Ready it Accessiblity: Good to go Resdy RAccessibility: Good to go Ready fo Accessibility: Good to go Ready T2 Accessibility: Good to go t Data (Power Refresh All Edit Links Stocks Currencies fx= DATEDIF(A34,"1/1/2022","D") Greg Metcalf works for a national credit card company, and he is performing a customer value analysis on a subset of credit card customers. In order to perform the RFM analysis on the customers, Greg has compiled the accompanying data file that contains the dates of the last transaction (LastiransactionDate), total number of transactions in 2017 and 2018 (Frequency, and total spending during 2017 and 2018 (Spending). Click here for the Excel Data Flle a. Greg wants to calculate the number of days between January 1, 2022, and the last transaction date. Create a now variable "Days Sincelast" that contains the number of days since the last transaction. (Hint: use the DATEDIF function if you are using Excel to complete this problem) What is the average number of days since the last purchase for alf the customers? Note: Round your answer to two decimat places. b. Create the RFM scores for each customec. How many customers have an RFM score of 455 ? What is their average spending? Note: Round "Average spending" to the nearest whole dollar amount. c. Create a new varisble catled "LogSpending* that contains the natural logarithms for the total spending during 2017 and 2018 . gin the logorithm values into 5 equal interval groups. Labed the groups using numbers 1 (lowest values) to 5 (highest vaiues). How many observations are in group 4? c. Create a new variable called "LogSpending" that contains the natural logarithms for the total spending during 2017 and 2018 . Bin the logarithm values into 5 equal-interval groups. Label the groups using numbers 1 (lowest values) to 5 (highest values). Haw many observations are in group 4 ? d. Create a new variable called "AverageOrderSize" that contains the averege spending per order. This is calculated by dividing total spending (Spending) by total number of transactions (Frequency) in 2017 and 2018 . Bin the values of AvorageOrderSize into 5 equalinterval groups. Label the groups using numbers 1 (lowest values) to 5 (highest values). How many observations are in group 4 ? e. Compare the number of observations in group 4 in parts c and d. Are the groupings the same or different? The groups in pans c and d are the same. The group in part c has fewer coservotions than the group in part d. The group in part chas more observalions thun the group in part d. One group has ne observations, whille the other group has 56 observatons Ready it Accessiblity: Good to go Resdy RAccessibility: Good to go Ready fo Accessibility: Good to go Ready T2 Accessibility: Good to go t Data (Power Refresh All Edit Links Stocks Currencies fx= DATEDIF(A34,"1/1/2022","D")