

Question
Greshak Company, Inc. is in the business of producing and marketing high-tech widgets. Assume you are a financial analyst at Greshak and have been charged
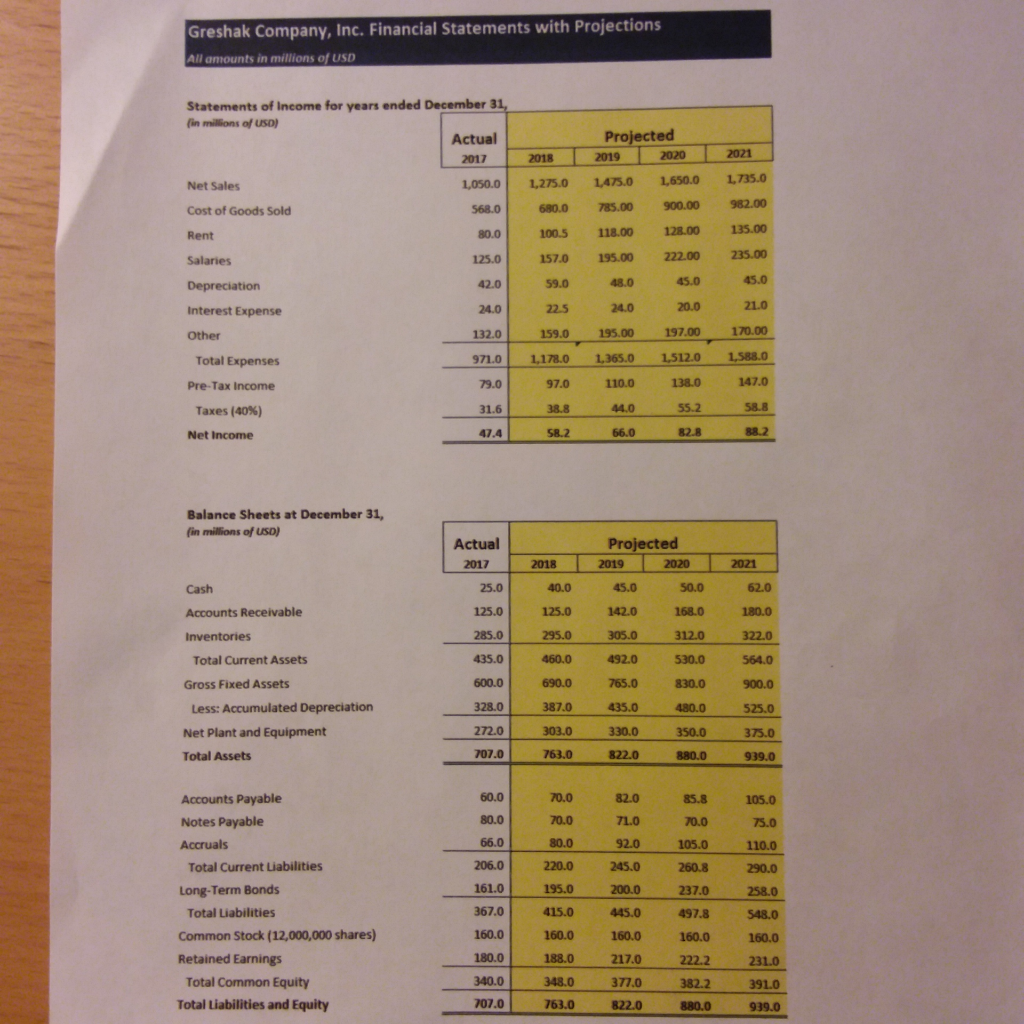
Greshak Company, Inc. is in the business of producing and marketing high-tech widgets. Assume you are a financial analyst at Greshak and have been charged with the task of estimating the value (i.e., intrinsic value) of the company's outstanding common stock at December 31, 2017. As part of that analysis, management has provided you with the company's most recent income statement and balance sheet for 2017 as well as financial projections of each for the next 4 years. Assume Greshak's applicable tax rate is 40% and that management has determined its weighted average cost of capital (WACC or discount rate) to be 14.0%. Further, assume Greshak has estimated its long-term sustainable growth rate (g) for its free cash flows (FCF) to be 3% upon reaching earnings stabilization after 2021 (the last year in the projection period).
Using MS-Excel and the template on the following pages, calculate the Intrinsic Value of Greshaks operations (i.e., the estimated value of the company) using the data above (hint see Supernormal Growth methodology in Chapter 6 and combine with Free Cash Flow methodology).
-
Projected Free Cash Flow Particulars Actual Projected Projected Projected Projected 2017 2018 2019 2020 2021 NOPAT: EBIT 79+24=103 119.5 134 158 168 tax @40% 41.2 47.8 53.6 63.2 67.2 NOPAT 61.8 71.7 80.4 94.8 100.8 Add: Depreciation 42 59 48 45 45 Operating Cash Flow 103.8 130.7 128.4 139.8 145.8 Total Operating Capital: Operating Current Assets: 435 460 492 530 564 Less: Operating Current Liabilities 206 220 245 260.8 290 Net Operating Working Capital 229 240 247 269.2 274 Investment in Net Working Capital NA 11 7 22.2 4.8 Annual Capital Expenditures NA 690-600=90 75 65 70 Total Investment in Operating Capital 101 82 87.2 74.8 Free Cash Flow: Operating Cash Flow NA 130.7 128.4 139.8 145.8 Less: Total Investment in Operating Capital NA 101 82 87.2 74.8 Projected Free Cash Flow NA 29.7 46.4 52.6 71
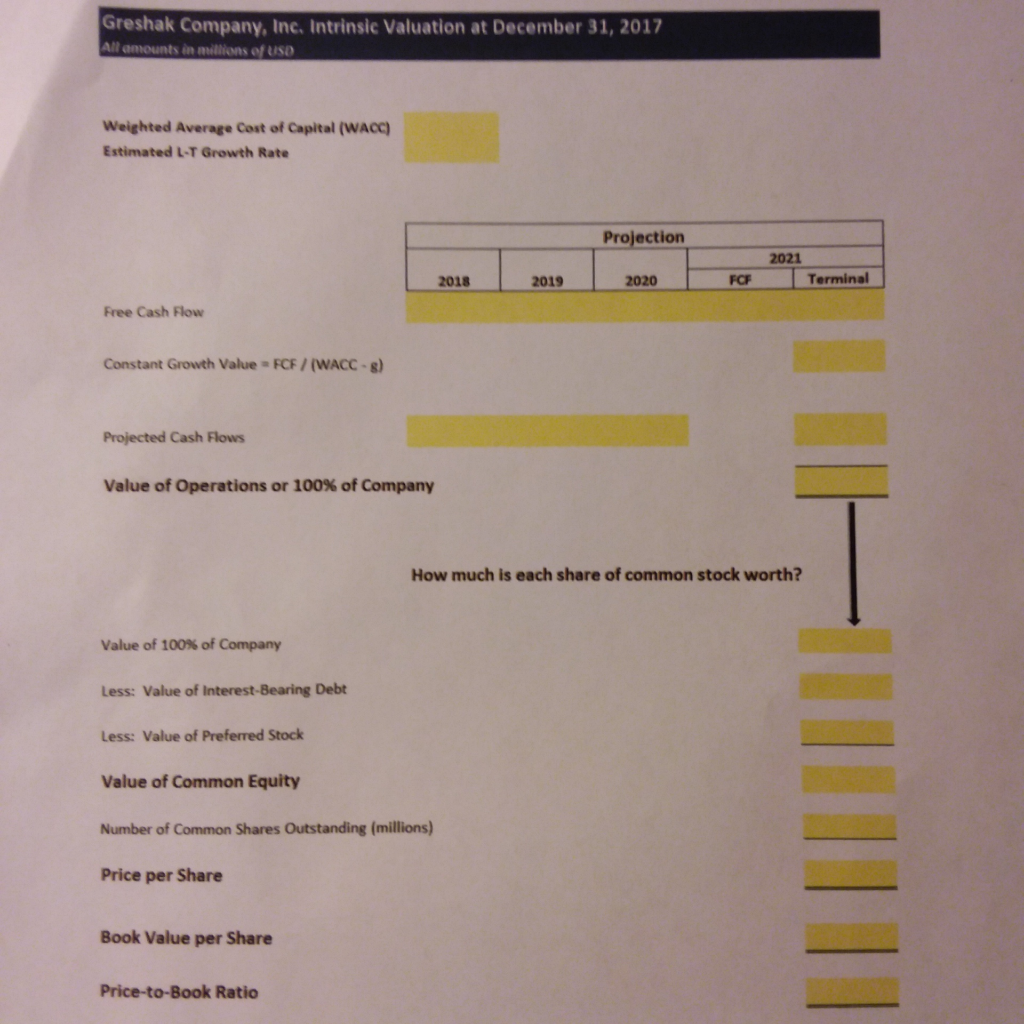
Greshak Company, Inc. Financial Statements with Projections All amounts in millions of USD Statements of Income for years ended December 31 in millions of USD) Actual Projected Net Sales Cost of Goods Sold Rent Salaries Depreciation Interest Expense 1,050.0 1,275.0 1475.0 1,650.0 1,735. 568.0 680.0 785.00 900.00 982.00 80.0 100.5 118.00 128.00 135.00 125.0 157.0 195.00 222.00 235.00 42.0 59.0 48.0 45.0 45.0 24.0 225 24.0 20.0 21.0 159.0 195.00 197.00 170.00 971. 1,1780 1.365.0 1,512.0 1,588.0 147.0 132.0 Total Expenses Pre-Tax Income 79.0 Taxes (40%) Net Income Balance Sheets at December 31, in millions of USD) Projected 2019 2020 Actual 2017 25.040.0 45.0 50.0 62.0 125.0 1250 142.0 168.0 1. Accounts Receivable 285.0 295.0 4835.0 800 920 53003640 Total Current Assets 600.0 690.0765.0 830.0 900.0 525.0 375.0 Gross Fixed Assets Less: Accumulated Depreciation Net Plant and Equipment Total Assets 328.0 387.0 303.0 763.0 435.0 480.0 272.0 330.0 939.0 Accounts Payable Notes Payable 60.070.082.0 85.8105.0 80.0 70.0 71O 70.0 75.0 80.0 105.0 110.0 206.0 220.0 245.0 0.3 290. Total Current Liabilities Long-Term Bonds 161.0 195.0 200.0 237.0 367.0 415.0 445.0 497.8 548.0 Total Liabilities Common Stock (12,000,000 shares) Retained Earnings 180.0 160.0 150.0 160.0 160.0 180.0 340.0 07.0 188.0 348.0 763.0822.0 217.0 231.0 Total Common Equity Total Liabilities and Equity 377.0 382.2 391.0 880.0 Greshak Company, Inc. Intrinsic Valuation at December 31, 2017 All amounts in millions of US0 Weighted Average Cost of Capital (WACC) Estimated L-T Growth Rate Projection 2021 2018 2020 FCF Terminal 2019 Free Cash Flow Constant Growth Value FCF/(WACC- Projected Cash Flows Value of Operations or 100% of Company How much is each share of common stock worth? value of 100% of Company Less: Value of Interest-Bearing Debt Less: Value of Preferred Stock Value of Common Equity Number of Common Shares Outstanding (millions) Price per Share Book Value per Share Price-to-Book Ratio
Step by Step Solution
There are 3 Steps involved in it
Step: 1

Get Instant Access to Expert-Tailored Solutions
See step-by-step solutions with expert insights and AI powered tools for academic success
Step: 2

Step: 3
Ace Your Homework with AI
Get the answers you need in no time with our AI-driven, step-by-step assistance
Get Started
Value Investing
Authors: Mike Hartley
1st Edition
979-8864443309