

Answered step by step
Verified Expert Solution
Question
1 Approved Answer
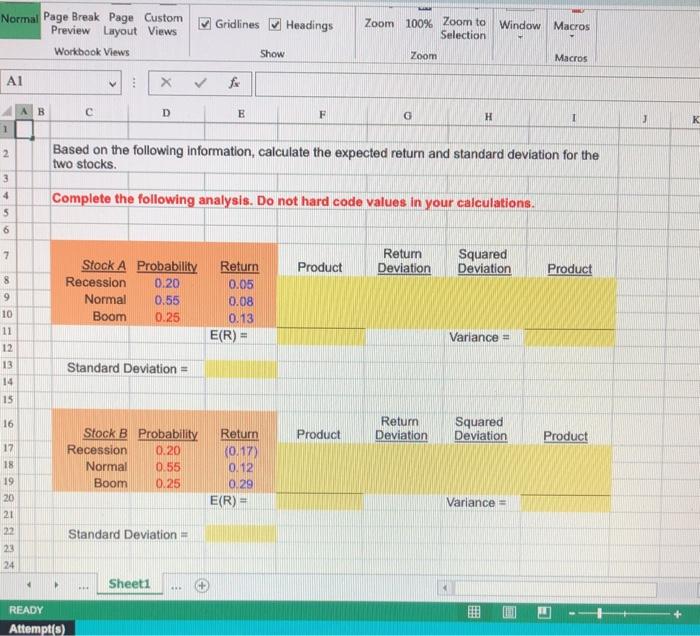
Gridlines Headings Normal Page Break Page Custom Preview Layout Views Workbook Views Zoom 100% Zoom to Selection Window Macros Show Zoom Macros fa AB D
Step by Step Solution
There are 3 Steps involved in it
Step: 1

Get Instant Access to Expert-Tailored Solutions
See step-by-step solutions with expert insights and AI powered tools for academic success
Step: 2

Step: 3
Ace Your Homework with AI
Get the answers you need in no time with our AI-driven, step-by-step assistance
Get Started
Cases In Financial Reporting
Authors: Ellen Engel, D. Eric Hirst, Mary Lea McAnally
8th Edition
1618531220, 9781618531223