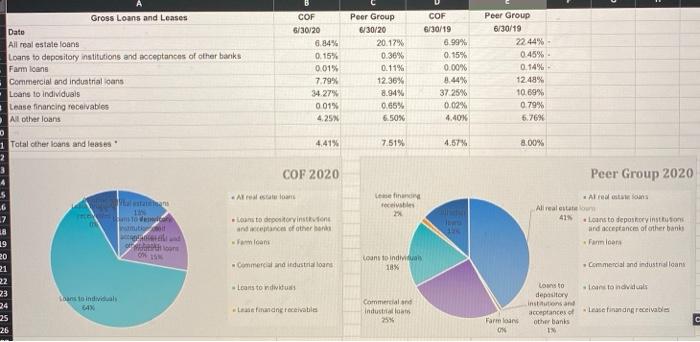
Gross Loans and Leases Dato All real estate loans Loans to depository institutions and acceptances of other banks Farm loans Commercial and industrial loans Loans to individuals Lease financing receivables All other loans D 1 Total other loans and leases COF 6/30/20 6.84% 0.15% 0.01% 7.79% 34.27% 0.01% 4.25% Peer Group 6/30/20 20.17% 0.36% 0.11% 12.36% 8.94% 0.65% 6.50% COF 6/30/19 5.99% 0.15% 0.00% 8.44% 37.25% 0.02% 4.40% Peer Group 6/30/19 22 44% 0.45% 0.14% 12.48% 10 69% 0.79% 6.76% 4.41% 7.51% 4.57% 8.00% COF 2020 recebe 2 Peer Group 2020 Almost sous All real estat 41% Loans to deployinston and acceptance of other banks Farmoon mitocol 18 Loans to depositorvinstone and of other hands Foam 1 OM Commercial and industrial loans count to indivi 18% Commercial and industrial loans 19 20 21 22 23 24 25 26 Loanston Antoindus Loans to individuals 84 Les and receivable Commercial and Industrial 25% Loans to depository institutions and acceptancese other banks IN Lascinanding receivables Farm loans ON C D. Write one paragraph comparing the pie charts of your BHC with its peer group for the most recent year-end (2011) data. Use the same format as the one in the textbook, incorporating a bulleted list to emphasize differences. E. Write one paragraph interpreting the excel spreadsheet data for your BHC using a bulleted list to focus the reader's attention on how your BHC's loan portfolio composition has changed over time. Gross Loans and Leases Dato All real estate loans Loans to depository institutions and acceptances of other banks Farm loans Commercial and industrial loans Loans to individuals Lease financing receivables All other loans D 1 Total other loans and leases COF 6/30/20 6.84% 0.15% 0.01% 7.79% 34.27% 0.01% 4.25% Peer Group 6/30/20 20.17% 0.36% 0.11% 12.36% 8.94% 0.65% 6.50% COF 6/30/19 5.99% 0.15% 0.00% 8.44% 37.25% 0.02% 4.40% Peer Group 6/30/19 22 44% 0.45% 0.14% 12.48% 10 69% 0.79% 6.76% 4.41% 7.51% 4.57% 8.00% COF 2020 recebe 2 Peer Group 2020 Almost sous All real estat 41% Loans to deployinston and acceptance of other banks Farmoon mitocol 18 Loans to depositorvinstone and of other hands Foam 1 OM Commercial and industrial loans count to indivi 18% Commercial and industrial loans 19 20 21 22 23 24 25 26 Loanston Antoindus Loans to individuals 84 Les and receivable Commercial and Industrial 25% Loans to depository institutions and acceptancese other banks IN Lascinanding receivables Farm loans ON C D. Write one paragraph comparing the pie charts of your BHC with its peer group for the most recent year-end (2011) data. Use the same format as the one in the textbook, incorporating a bulleted list to emphasize differences. E. Write one paragraph interpreting the excel spreadsheet data for your BHC using a bulleted list to focus the reader's attention on how your BHC's loan portfolio composition has changed over time