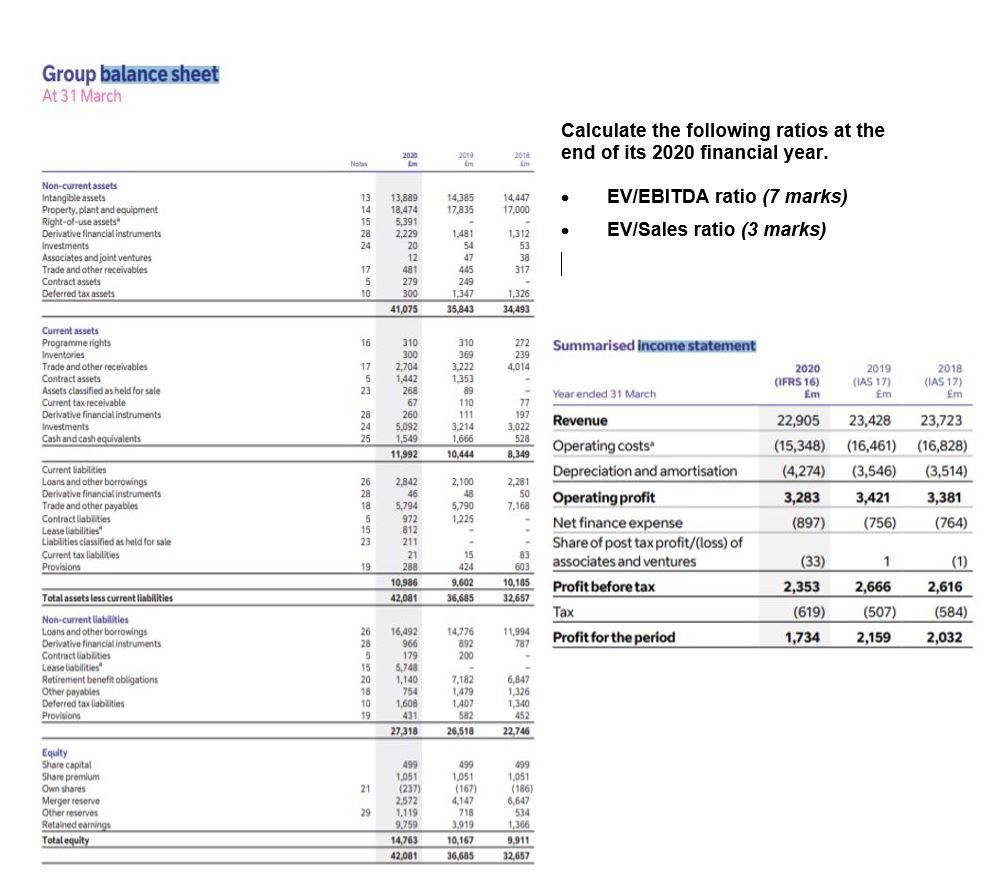
Group balance sheet At 31 March Calculate the following ratios at the end of its 2020 financial year. 2020 2010 2010 im Not . 14,385 17,835 14,447 17,000 Non-current assets Intangible assets Property, plant and equipment Right-of-use assets Derivative financial instruments Investments Associates and joint ventures Trade and other receivables Contract assets Deferred tax assets 13 14 15 28 24 EV/EBITDA ratio (7 marks) EV/Sales ratio (3 marks) 13,889 18,474 5,391 2,229 20 12 481 279 300 41,075 1,481 54 47 445 249 1.347 35,843 1,312 53 38 317 17 5 5 10 1,326 34,493 16 Summarised income statement 272 239 4,014 - Current assets Programme rights Inventories Trade and other receivables Contract assets Assets classified as held for sale Current tax receivable Derivative financial instruments Investments Cash and cash equivalents 17 5 23 310 300 2,704 1,442 268 67 260 5,092 1,549 11,992 310 369 3,222 1.353 89 110 111 3,214 1,666 10,444 2020 (IFRS 16) ( m 2019 (IAS 17) Em 2018 (IAS 17) Em Year ended 31 March 28 24 25 77 197 3,022 528 8,349 Current abilities Loans and other borrowings Derivative financial instruments Trade and other payables Contract liabilities Lease liabilities Llabilities classified as held for sale Current tax liabilities Provisions 22,905 23,428 23,723 (15,348) (16,461) (16,828) (4,274) (3,546) (3,514) 3,283 3,421 3,381 (897) (756) (764) 2,281 50 7,168 26 28 ta 5 15 23 2,100 48 5,790 1.225 Revenue Operating costs Depreciation and amortisation Operating profit Net finance expense Share of post tax profit/(loss) of associates and ventures 2,842 46 5,794 972 812 211 21 288 10,986 42,081 (33) 1 19 - 15 424 9,602 36,685 83 603 10,185 32,657 (1) 2,616 Profit before tax 2,353 2,666 Total assets less current liabilities 11,994 (619) 1,734 Tax Profit for the period (507) 2,159 (584) 2,032 14,776 892 200 787 Non-current liabilities Loans and other borrowings Derivative financial instruments Contract liabilities Lease liabilities Retirement benefit obligations Other payables Deferred tax liabilities Provisions 26 28 5 15 20 18 10 19 16,492 966 179 5,748 1,140 754 1,608 431 27,318 7,182 1,479 1407 582 26,518 6,847 1,326 1,340 452 22,746 21 Equity Share capital Share premium Own shares Merger reserve Other reserves Retained earnings Total equity 29 499 1,051 (237) 2,572 1.119 9.259 14763 42,061 499 1,051 (167) 4,147 718 3,919 10,167 36,685 499 1,051 (186) 6,647 534 1,366 9,911 32.657 Group balance sheet At 31 March Calculate the following ratios at the end of its 2020 financial year. 2020 2010 2010 im Not . 14,385 17,835 14,447 17,000 Non-current assets Intangible assets Property, plant and equipment Right-of-use assets Derivative financial instruments Investments Associates and joint ventures Trade and other receivables Contract assets Deferred tax assets 13 14 15 28 24 EV/EBITDA ratio (7 marks) EV/Sales ratio (3 marks) 13,889 18,474 5,391 2,229 20 12 481 279 300 41,075 1,481 54 47 445 249 1.347 35,843 1,312 53 38 317 17 5 5 10 1,326 34,493 16 Summarised income statement 272 239 4,014 - Current assets Programme rights Inventories Trade and other receivables Contract assets Assets classified as held for sale Current tax receivable Derivative financial instruments Investments Cash and cash equivalents 17 5 23 310 300 2,704 1,442 268 67 260 5,092 1,549 11,992 310 369 3,222 1.353 89 110 111 3,214 1,666 10,444 2020 (IFRS 16) ( m 2019 (IAS 17) Em 2018 (IAS 17) Em Year ended 31 March 28 24 25 77 197 3,022 528 8,349 Current abilities Loans and other borrowings Derivative financial instruments Trade and other payables Contract liabilities Lease liabilities Llabilities classified as held for sale Current tax liabilities Provisions 22,905 23,428 23,723 (15,348) (16,461) (16,828) (4,274) (3,546) (3,514) 3,283 3,421 3,381 (897) (756) (764) 2,281 50 7,168 26 28 ta 5 15 23 2,100 48 5,790 1.225 Revenue Operating costs Depreciation and amortisation Operating profit Net finance expense Share of post tax profit/(loss) of associates and ventures 2,842 46 5,794 972 812 211 21 288 10,986 42,081 (33) 1 19 - 15 424 9,602 36,685 83 603 10,185 32,657 (1) 2,616 Profit before tax 2,353 2,666 Total assets less current liabilities 11,994 (619) 1,734 Tax Profit for the period (507) 2,159 (584) 2,032 14,776 892 200 787 Non-current liabilities Loans and other borrowings Derivative financial instruments Contract liabilities Lease liabilities Retirement benefit obligations Other payables Deferred tax liabilities Provisions 26 28 5 15 20 18 10 19 16,492 966 179 5,748 1,140 754 1,608 431 27,318 7,182 1,479 1407 582 26,518 6,847 1,326 1,340 452 22,746 21 Equity Share capital Share premium Own shares Merger reserve Other reserves Retained earnings Total equity 29 499 1,051 (237) 2,572 1.119 9.259 14763 42,061 499 1,051 (167) 4,147 718 3,919 10,167 36,685 499 1,051 (186) 6,647 534 1,366 9,911 32.657


