Answered step by step
Verified Expert Solution
Link Copied!

Question

1 Approved Answer

Group Case Study Income Statements Lewis 25,120,000 Ramsey $ 50,420,000 Net Sales Costs and expenses: Cost of Goods Sold Selling Expenses Administrative Expenses Total Costs
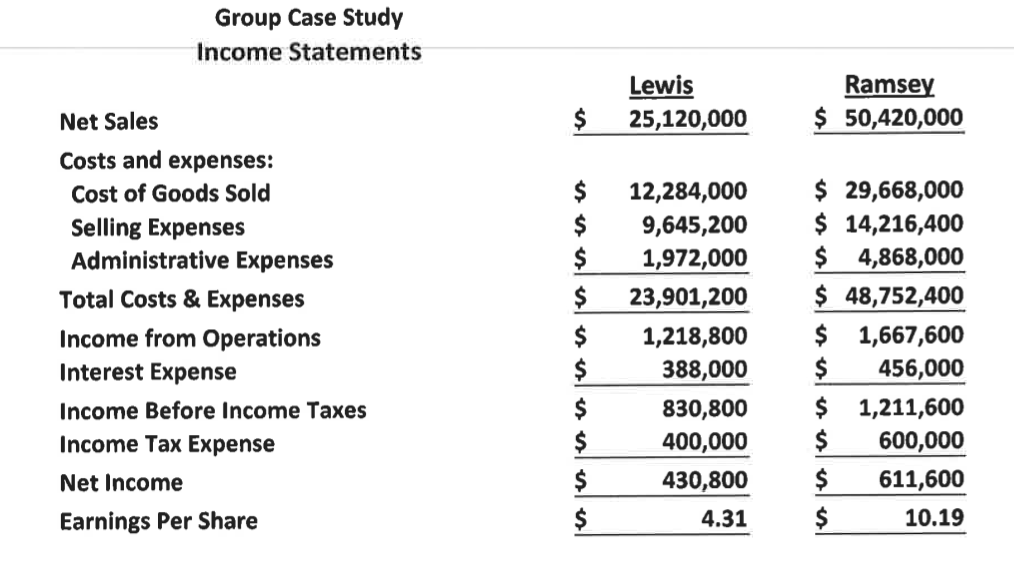
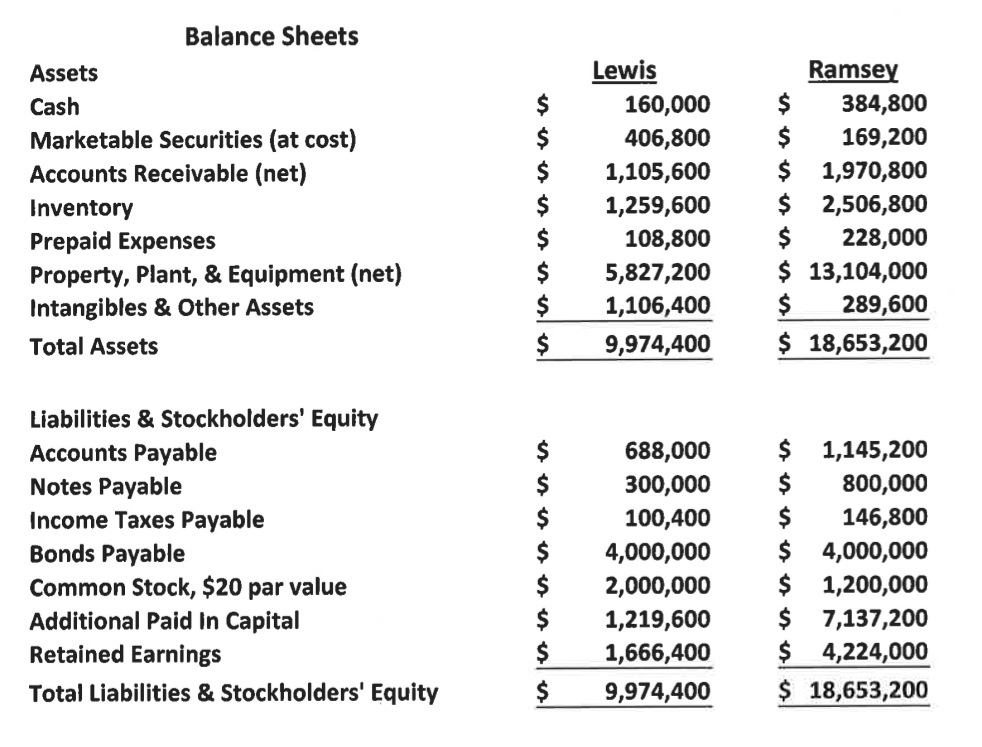
image text in transcribed

image text in transcribed

image text in transcribed

image text in transcribed

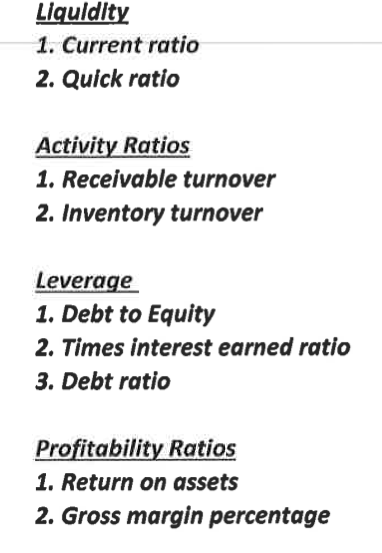
Group Case Study Income Statements Lewis 25,120,000 Ramsey $ 50,420,000 Net Sales Costs and expenses: Cost of Goods Sold Selling Expenses Administrative Expenses Total Costs & Expenses Income from Operations Interest Expense Income Before Income Taxes Income Tax Expense Net Income Earnings Per Share $ $ $ $ $ 12,284,000 9,645,200 1,972,000 23,901,200 1,218,800 388,000 830,800 400,000 430,800 $ 29,668,000 $ 14,216,400 $ 4,868,000 $ 48,752,400 $ 1,667,600 $ 456,000 $ 1,211,600 $ 600,000 611,600 $ 10.19 $ $ $ $ $ $ 4.31 Balance Sheets Assets Cash Marketable Securities (at cost) Accounts Receivable (net) Inventory Prepaid Expenses Property, Plant, & Equipment (net) Intangibles & Other Assets Total Assets $ $ $ $ $ $ Lewis 160,000 406,800 1,105,600 1,259,600 108,800 5,827,200 1,106,400 9,974,400 Ramsey 384,800 169,200 $ 1,970,800 $ 2,506,800 $ 228,000 $ 13,104,000 $ 289,600 $ 18,653,200 $ Liabilities & Stockholders' Equity Accounts Payable Notes Payable Income Taxes Payable Bonds Payable Common Stock, $20 par value Additional Paid In Capital Retained Earnings Total Liabilities & Stockholders' Equity $ $ $ 688,000 300,000 100,400 4,000,000 2,000,000 1,219,600 1,666,400 9,974,400 $ 1,145,200 800,000 146,800 $ 4,000,000 $ 1,200,000 $ 7,137,200 $ 4,224,000 $ 18,653,200 $ is Required: 1. Calculate the 9 financial ratios listed below for Lewis and Ramsey 2. Indicate which Co. has the stronger ratio and why 3. What does the ratio reveal about the Company's results 4. Which Company provides the better overall operarting risk and why Liquidity 1. Current ratio 2. Quick ratio Activity Ratios 1. Receivable turnover 2. Inventory turnover Leverage 1. Debt to Equity 2. Times interest earned ratio 3. Debt ratio Profitability Ratios 1. Return on assets 2. Gross margin percentage

Step by Step Solution

There are 3 Steps involved in it

Step: 1

blur-text-image

Get Instant Access to Expert-Tailored Solutions

See step-by-step solutions with expert insights and AI powered tools for academic success

Step: 2

blur-text-image_2

Step: 3

blur-text-image_3

Ace Your Homework with AI

Get the answers you need in no time with our AI-driven, step-by-step assistance

Get Started

Recommended Textbook for

The Training And Development Audit

Authors: Rosemary Harrison

2nd Edition

0955970725, 978-0955970726

More Books

Students also viewed these Accounting questions