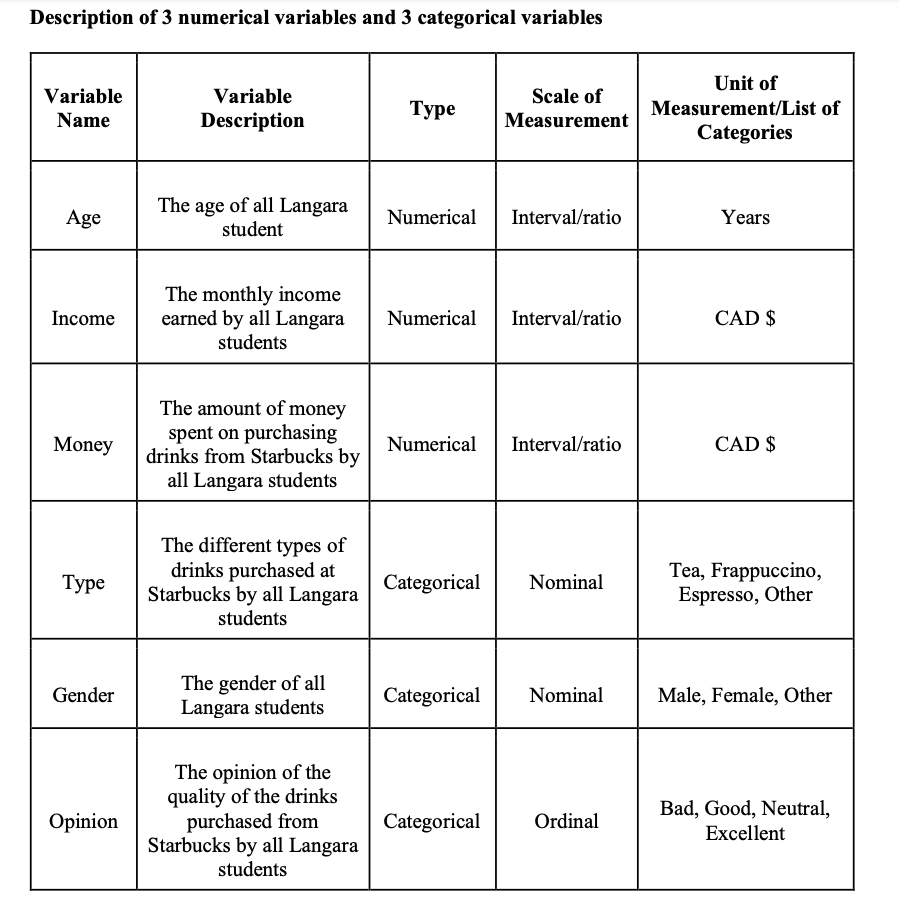
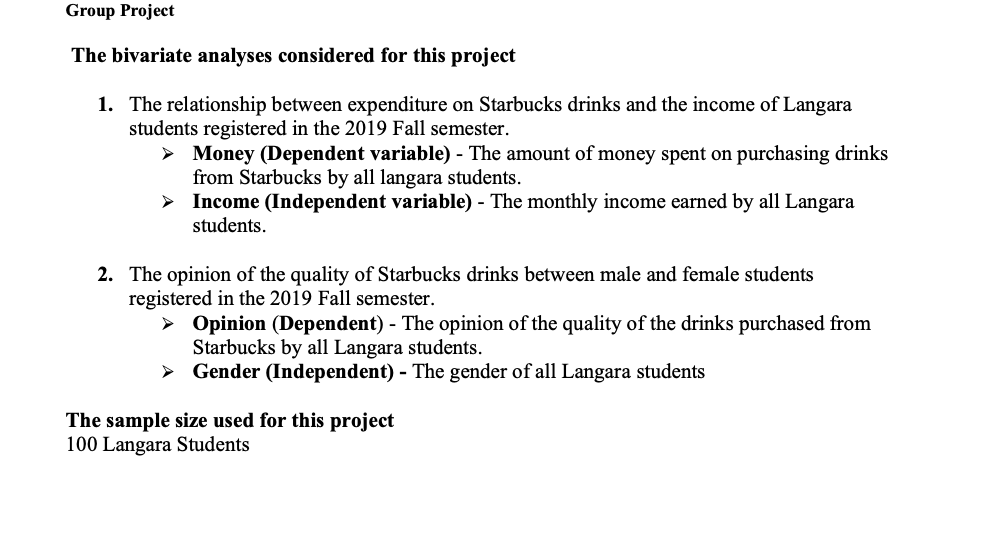
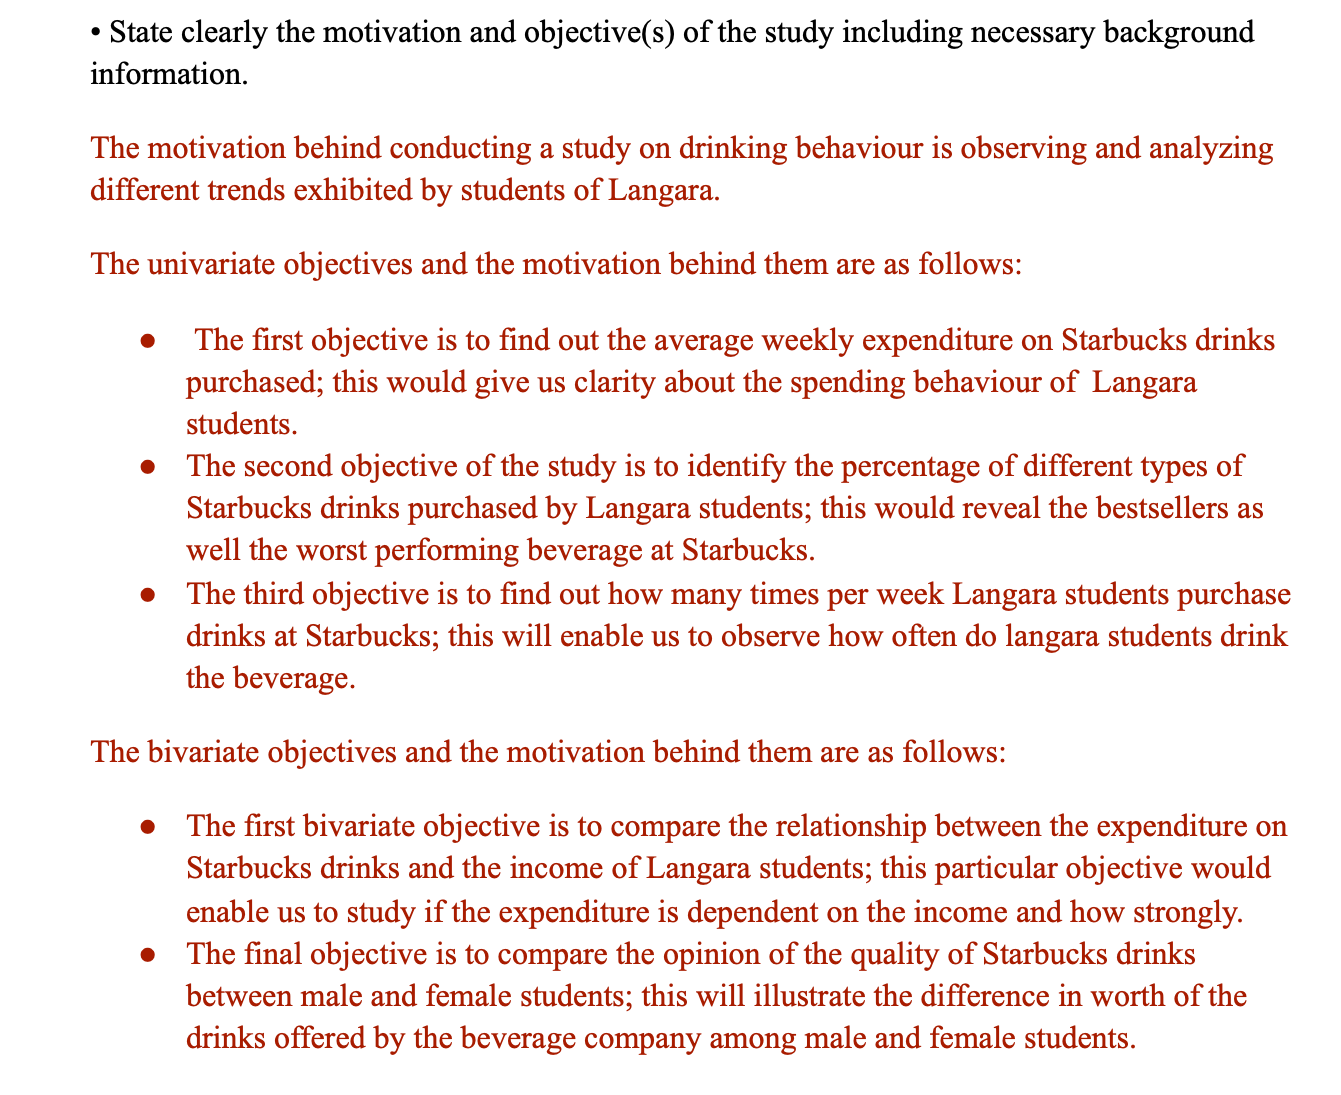
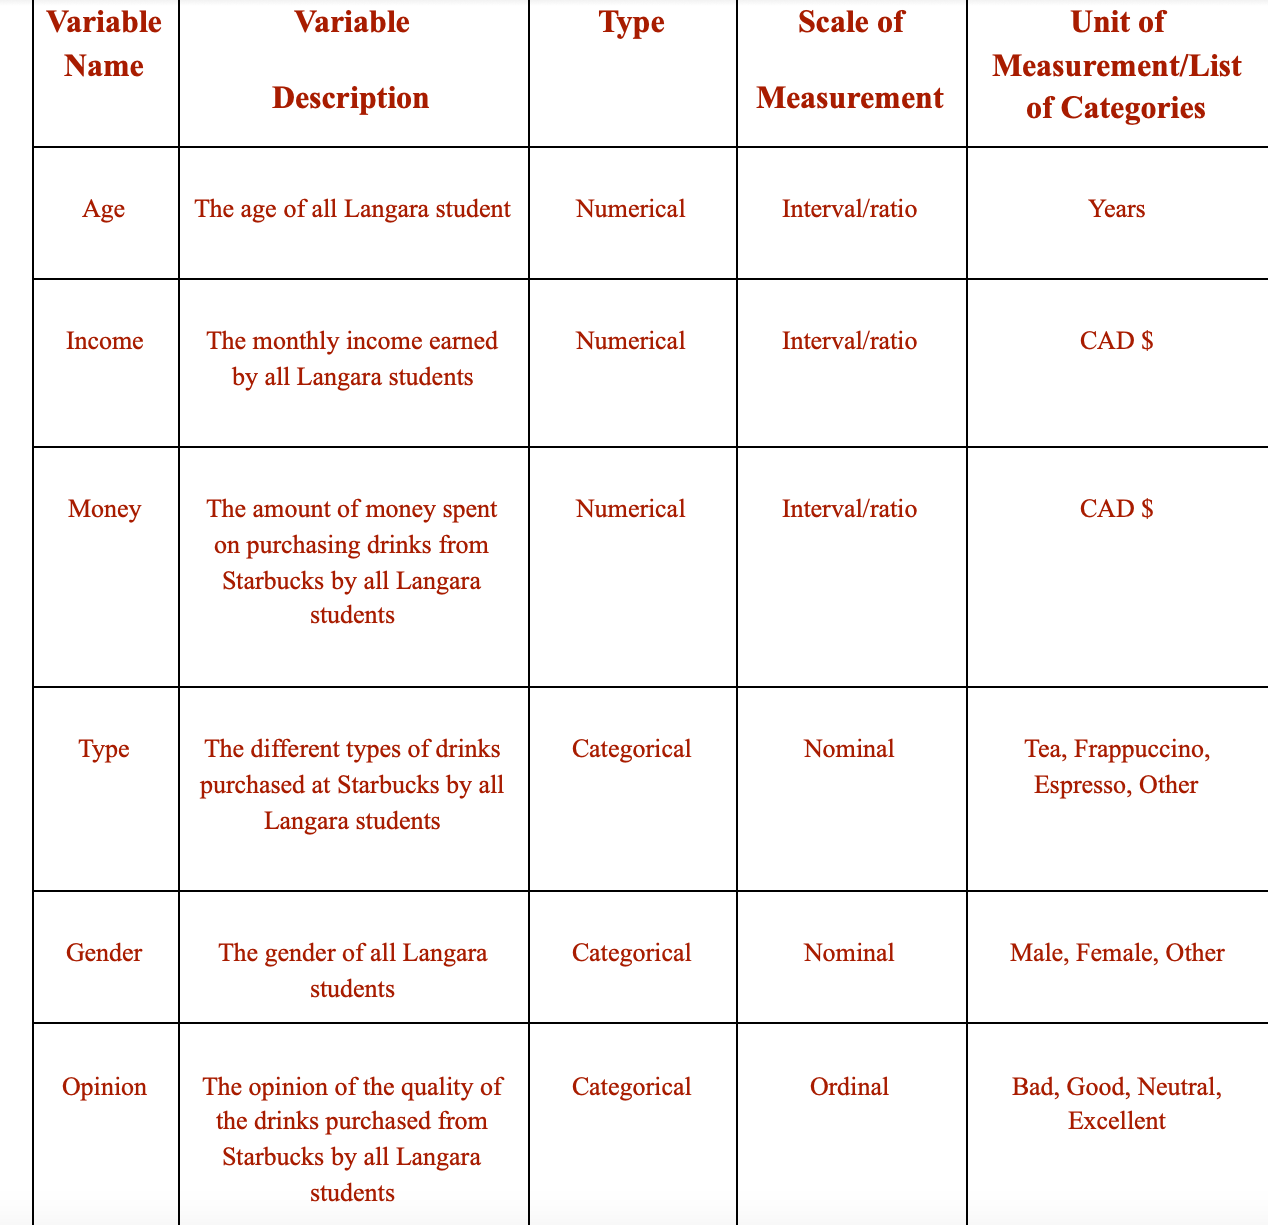
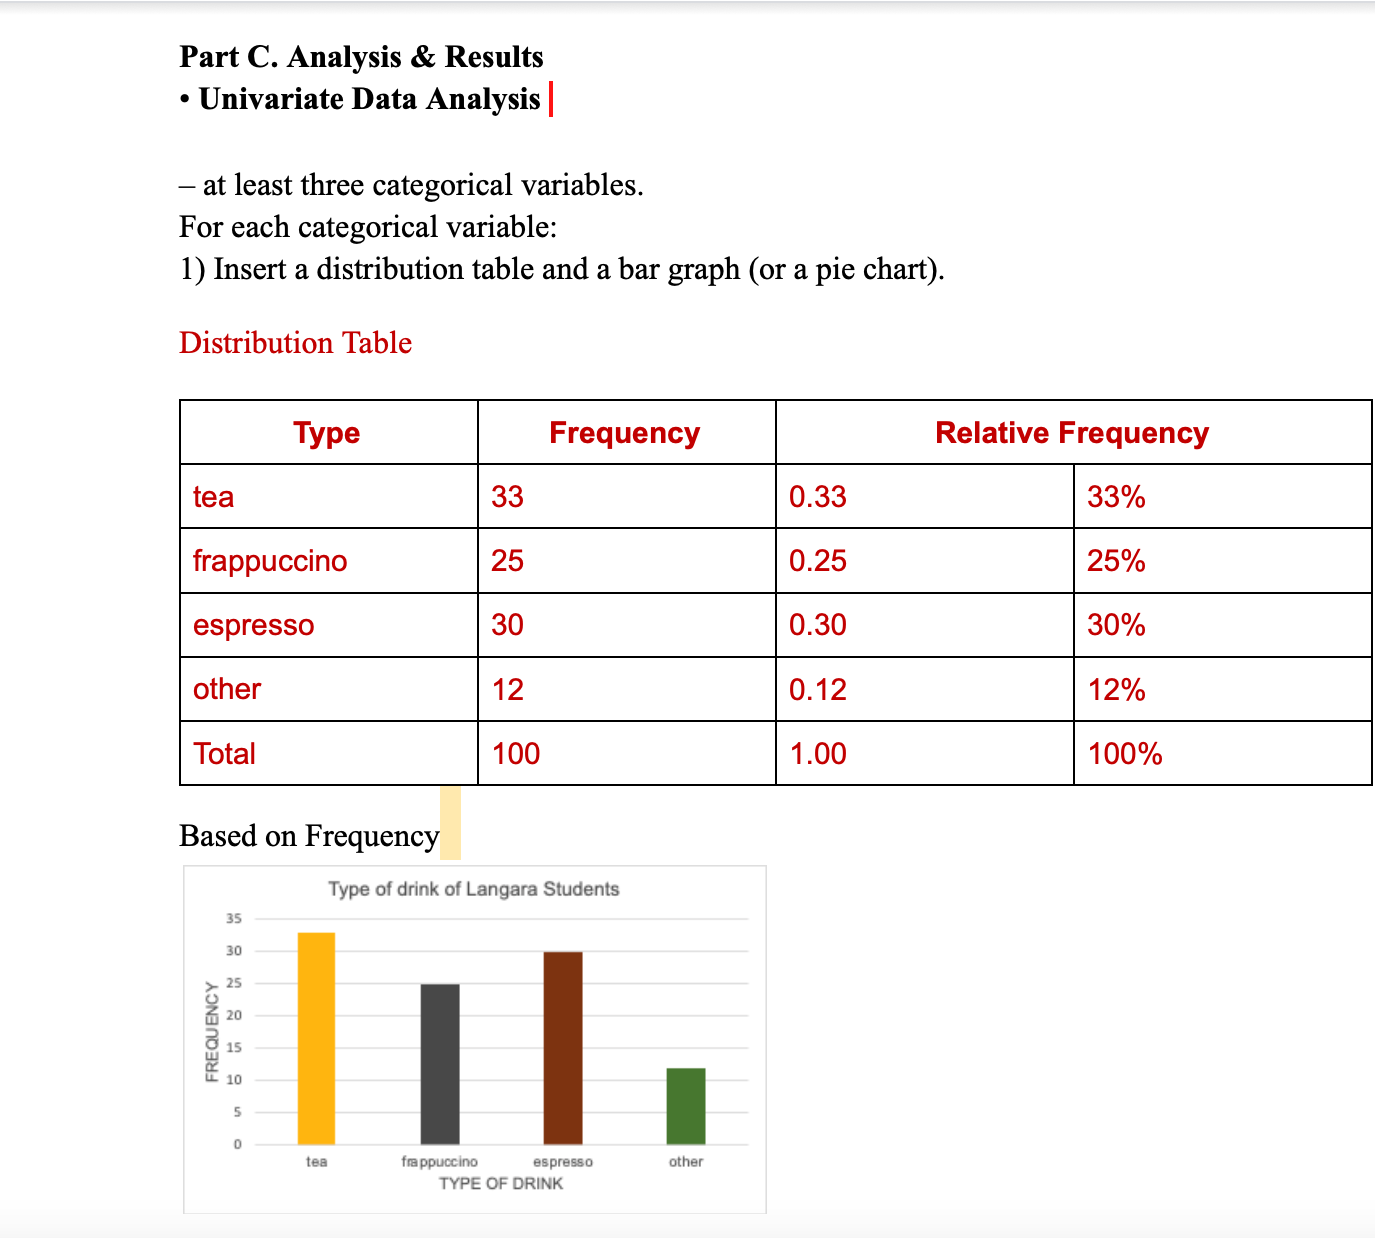
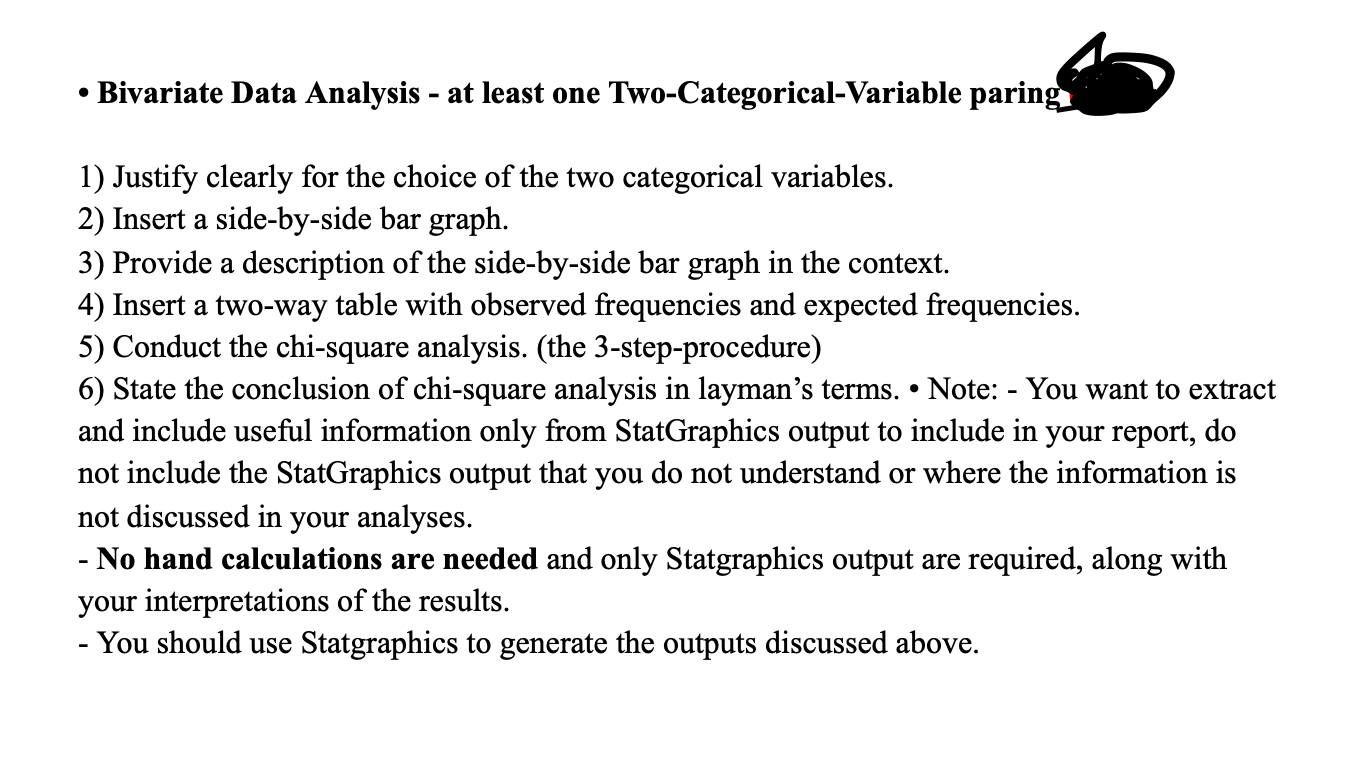
Group Project Project Topic A study on students' drinking behavior at Langara College. The objectives of the project Univariate Objectives . To nd out how much money is spent weekly on Starbucks drinks purchased by Langara students registered in the 2019 Fall semester. . To identify the different types of Starbucks drinks purchased by Langara students registered in the 2019 Fall semester. . To nd out how many times per week Langara students registered in the 2019 Fall semester purchase drinks at Starbucks. Bivariate Objectives . To compare the relationship between the expenditure on Starbucks drinks and the income of Langara students registered in the 2019 Fall semester. . To compare the opinion of the quality of Starbucks drinks between male and female students registered in the 2019 Fall semester. Description of the subjects Langara students registered in the 2019 Fall semester. Description of the Population All Langara students registered in the 2019 Fall semester who purchase drinks from Starbucks. The variables for this project Type Gender Age Frequency Opinion Money Income HP'PPP'PL' Description of 3 numerical variables and 3 categorical variables Unit of Variable Variable Scale of Measurement Measurement/List of Name Description Type Categories The age of all Langara Age Numerical Interval/ratio Years student The monthly income Income earned by all Langara Numerical Interval/ratio CAD $ students The amount of money Money spent on purchasing drinks from Starbucks by Numerical Interval/ratio CAD $ all Langara students The different types of Type drinks purchased at Categorical Nominal Tea, Frappuccino, Starbucks by all Langara Espresso, Other students Gender The gender of all Langara students Categorical Nominal Male, Female, Other The opinion of the quality of the drinks Bad, Good, Neutral, Opinion purchased from Categorical Ordinal Excellent Starbucks by all Langara studentsGroup Project The bivariate analyses considered for this project 1. The relationship between expenditure on Starbucks drinks and the income of Langara students registered in the 2019 Fall semester. >~ Money (Dependent variable} - The amount of money spent on purchasing drinks from Starbucks by all langara students. >~ Income (Independent variable) - The monthly income earned by all Langara students. 2. The opinion of the quality of Starbucks drinks between male and female students registered in the 2019 Fall semester. > Opinion (Dependent) - The opinion of the quality of the drinks purchased from Starbucks by all Langara students. > Gender (Independent) - The gender of all Langara students The sample size used for this project 100 Langara Students . State clearly the motivation and objective(s) of the study including necessary background information. The motivation behind conducting a study on drinking behaviour is observing and analyzing different trends exhibited by students of Langara. The univariate objectives and the motivation behind them are as follows: . The first objective is to find out the average weekly expenditure on Starbucks drinks purchased; this would give us clarity about the spending behaviour of Langara students. . The second objective of the study is to identify the percentage of different types of Starbucks drinks purchased by Langara students; this would reveal the bestsellers as well the worst performing beverage at Starbucks. . The third objective is to find out how many times per week Langara students purchase drinks at Starbucks; this will enable us to observe how often do langara students drink the beverage. The bivariate objectives and the motivation behind them are as follows: The first bivariate objective is to compare the relationship between the expenditure on Starbucks drinks and the income of Langara students; this particular objective would enable us to study if the expenditure is dependent on the income and how strongly. . The final objective is to compare the opinion of the quality of Starbucks drinks between male and female students; this will illustrate the difference in worth of the drinks offered by the beverage company among male and female students.Variable Name Income Money CD Gender 3. a. 8 Variable Description The age of all Langara student The monthly income earned by all Langara students The amount of money spent on purchasing drinks from Starbucks by all Langara students The different types of drinks purchased at Starbucks by all Langara students The gender of all Langara students The opinion of the quality of the drinks purchased from Starbucks by all Langara students Numerical Numerical Numerical Categorical Categorical Categorical Scale of Measurement Intervalfratio Interval/ratio Interval/ratio Nominal Nominal Ordinal Unit of Measurement/List of Categories Years CAD$ CAD$ Tea, Frappuccino, Espresso, Other Male, Female, Other Bad, Good, Neutral, Excellent Part C. Analysis & Results - Univariate Data Analysis I at least three categorical variables. For each categorical variable: 1) Insert a distribution table and a bar graph (or a pie chart). Distribution Table _ Based on Frequency Type of drink of Langara Students >. 25 2|] .1 5 0 tea fl! panache espresso other TYPE OF DRINK FREDUENC 5 n - Bivariate Data Analysis - at least one 'IWo-Categorical-Variable paring\" 1) Justify clearly for the choice of the two categorical variables. 2) Insert a side-byside bar graph. 3) Provide a description of the side-byside bar graph in the context. 4) Insert a two-way table with observed frequencies and expected frequencies. 5) Conduct the chi-square analysis. (the 3-stepprocedure) 6) State the conclusion of chi-square analysis in layman's terms. - Note: - You want to extract and include useful information only from StatGraphics output to include in your report, do not include the StatGraphics output that you do not understand or where the information is not discussed in your analyses. - No hand calculations are needed and only Statgraphics output are required, along with your interpretations of the results. - You should use Statgraphics to generate the outputs discussed above