Answered step by step
Verified Expert Solution
Link Copied!

Question

1 Approved Answer

Group Writing Assignment Chapter 14: Globalization LEADING WITH CRITICAL THINKING SKILLS: Emerging or Submerging Markets The BRIC countries are large emerging markets that are poised

Group Writing Assignment

Chapter 14: Globalization

LEADING WITH CRITICAL THINKING SKILLS: Emerging or Submerging Markets

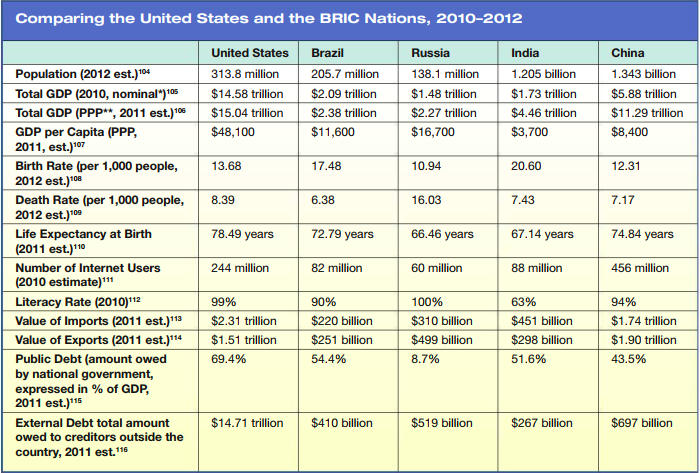
The BRIC countries are large emerging markets that are poised for major growth; however, in our networked global economy, global recession affects every country in the network. For example, China may continue to produce massive quantities of goods, but their customer countries may reduce the amount of goods they purchase because of the global recession.

1. Review the table of statistics in Exhibit 14.8 and research any changes to the stats of the five countries. You can use the CIA World Factbook, the IMF or the World Bank as online resources for gathering your numbers. Be sure to check statistics such as:

* Public debt

* External debt

* Value of imports

* Value of exports

* Total GDP

* GDP per capita

This data should be displayed in a table format (either Google, Word, or Excel) and should clearly notate the statistical differences for each category for each country.

2. Next, identify some new opportunities and risks currently faced by BRIC countries. Have opportunities and risks changed dramatically? Have new opportunities and new risks arisen? If yes, what are they?

3. South Africa and Indonesia are also important emerging markets. Using the CIA World Factbook, the IMF or the World Bank as online resources, gather data related to the public and external debts, value of imports and exports, total GDP and GDP per capita of these nations. How do they compare to the BRIC countries in terms of these statistics and in terms of the risks and opportunities they present?

Exhibit 14.8:

image text in transcribed

Comparing the United States and the BRIC Nations, 2010-2012 United States 313.8 million $14.58 trillion $15.04 trillion $48,100 Brazil 205.7 million $2.09 trillion $2.38 trillion $11,600 Russia 138.1 million $1.48 trillion $2.27 trillion $16,700 India 1.205 billion $1.73 trillion $4.46 trillion $3,700 China 1.343 billion $5.88 trillion $11.29 trillion $8,400 13.68 17.48 10.94 20.60 12.31 8.39 6.38 16.03 7.43 7.17 78.49 years 72.79 years 66.46 years 67.14 years 74.84 years Population (2012 est.) 104 Total GDP (2010, nominal,105 Total GDP (PPP**, 2011 est.) GDP per capita (PPP, 2011, est.)107 Birth Rate (per 1,000 people, 2012 est.) 108 Death Rate (per 1,000 people, 2012 est.) 100 Life Expectancy at Birth (2011 est.) 110 Number of Internet Users (2010 estimate)11 Literacy Rate (2010)112 Value of Imports (2011 est.)*13 Value of Exports (2011 est.) 14 Public Debt (amount owed by national government, expressed in % of GDP, 2011 est.)115 External Debt total amount owed creditors outside the country, 2011 est. 116 244 million 82 million 60 million 88 million 456 million 99% $2.31 trillion $1.51 trillion 69.4% 90% $220 billion $251 billion 54.4% 100% $310 billion $499 billion 8.7% 63% $451 billion $298 billion 51.6% 94% $1.74 trillion $1.90 trillion 43.5% $14.71 trillion $410 billion $519 billion $267 billion $697 billion Comparing the United States and the BRIC Nations, 2010-2012 United States 313.8 million $14.58 trillion $15.04 trillion $48,100 Brazil 205.7 million $2.09 trillion $2.38 trillion $11,600 Russia 138.1 million $1.48 trillion $2.27 trillion $16,700 India 1.205 billion $1.73 trillion $4.46 trillion $3,700 China 1.343 billion $5.88 trillion $11.29 trillion $8,400 13.68 17.48 10.94 20.60 12.31 8.39 6.38 16.03 7.43 7.17 78.49 years 72.79 years 66.46 years 67.14 years 74.84 years Population (2012 est.) 104 Total GDP (2010, nominal,105 Total GDP (PPP**, 2011 est.) GDP per capita (PPP, 2011, est.)107 Birth Rate (per 1,000 people, 2012 est.) 108 Death Rate (per 1,000 people, 2012 est.) 100 Life Expectancy at Birth (2011 est.) 110 Number of Internet Users (2010 estimate)11 Literacy Rate (2010)112 Value of Imports (2011 est.)*13 Value of Exports (2011 est.) 14 Public Debt (amount owed by national government, expressed in % of GDP, 2011 est.)115 External Debt total amount owed creditors outside the country, 2011 est. 116 244 million 82 million 60 million 88 million 456 million 99% $2.31 trillion $1.51 trillion 69.4% 90% $220 billion $251 billion 54.4% 100% $310 billion $499 billion 8.7% 63% $451 billion $298 billion 51.6% 94% $1.74 trillion $1.90 trillion 43.5% $14.71 trillion $410 billion $519 billion $267 billion $697 billion

Step by Step Solution

There are 3 Steps involved in it

Step: 1

blur-text-image

Get Instant Access to Expert-Tailored Solutions

See step-by-step solutions with expert insights and AI powered tools for academic success

Step: 2

blur-text-image

Step: 3

blur-text-image

Ace Your Homework with AI

Get the answers you need in no time with our AI-driven, step-by-step assistance

Get Started

Recommended Textbook for

Financial Accounting Objective Questions And Explanations

Authors: Irvin N. Gleim

7th Edition

0917539664, 978-0917539664

More Books

Students also viewed these Accounting questions