Guess what its time for a real world scenario!!! In our content folder for this exam, you will see a link attached that will direct you to Apples Consolidated Statements (Unaudited). Using their financials, create a table in Excel like this:
| Ratio | 2019 | 2018 |
| Current Ratio | ??? | ??? |
| Return on Total Assets | ??? | ??? |
| Return on Equity | ??? | ??? |
| Operating Profit Margin | ??? | ??? |
| Debt to Equity Ratio | ??? | ??? |
- Calculate the ratio for each year. What does your calculation tell you about each ratio? What does the change mean? Did it improve or get worse? What constitutes improvement vs. what signifies worsening?
Recreate the Consolidated Balance Sheet in a SEPARATE worksheet. It can be labeled Question 3_Part2. Here, you will use Excels outlining feature to collapse the categories by their totals. For example, Current Assets should be collapsed to where you can expand to see cash and cash equivalents, marketable securities, and so on. You will do this for all three sections of the balance sheet.
Can you please show work and excel functions? Thank you.
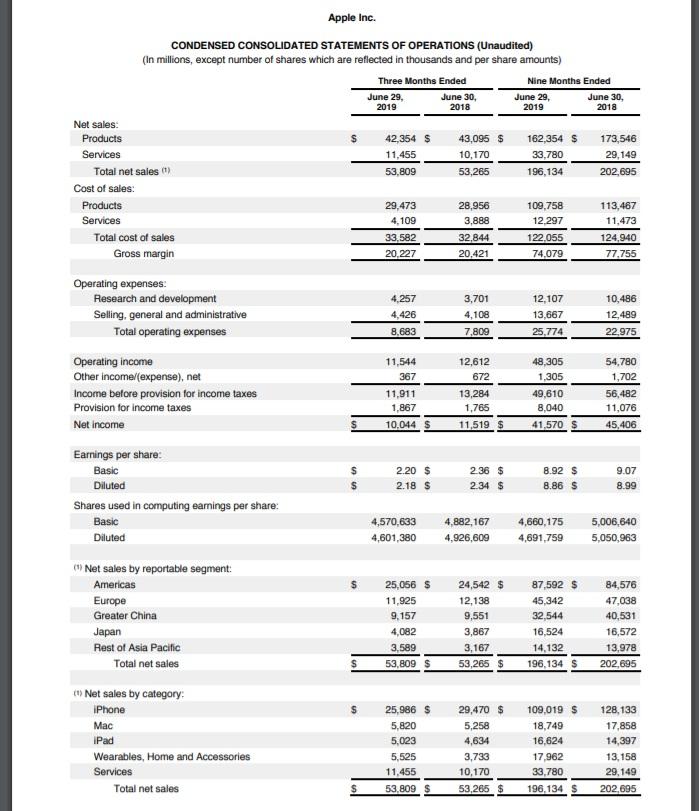
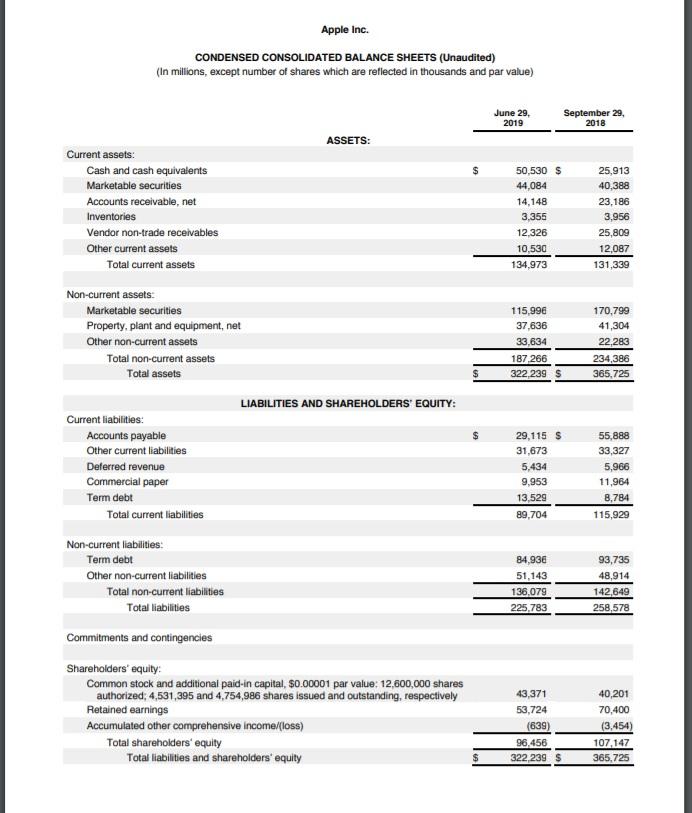
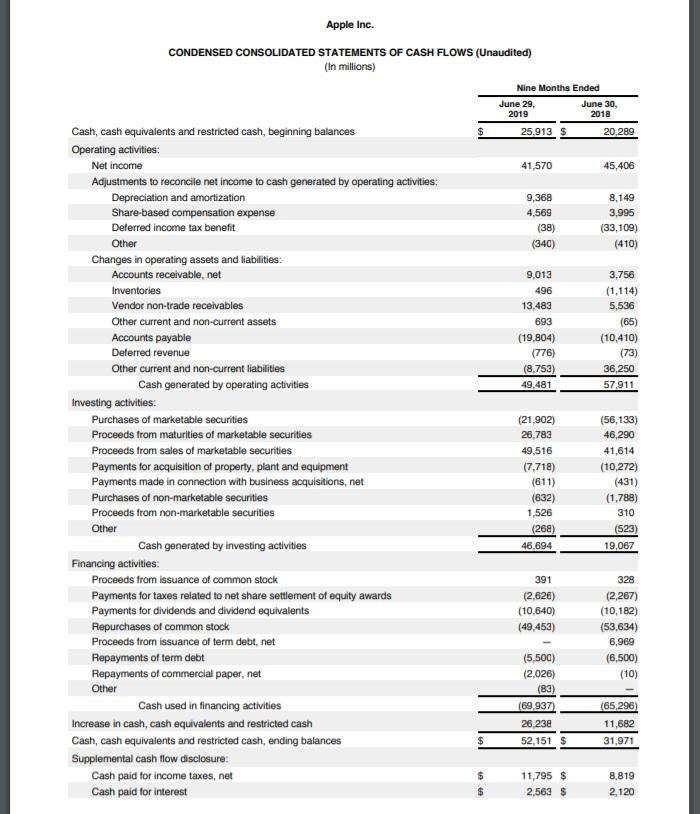
Apple Inc. CONDENSED CONSOLIDATED STATEMENTS OF OPERATIONS (Unaudited) (In millions, except number of shares which are reflected in thousands and per share amounts) Three Months Ended Nine Months Ended June 29, June 30, June 29, June 30, 2019 2018 2019 2018 Net sales: Products $ 42,354 $ 43,095 $ 162,354 $ 173,546 Services 11,455 10,170 33,780 29,149 Total net sales 53,809 53,265 196,134 202,695 Cost of sales: Products 29,473 28,956 109,758 113,467 Services 4,109 3,888 12.297 11,473 Total cost of sales 33,582 32,844 122.055 124,940 Gross margin 20,227 20,421 74,079 77,755 12.107 Operating expenses. Research and development Selling, general and administrative Total operating expenses 4,257 4,426 3,701 4,108 7,809 13,667 25,774 10,486 12,489 22,975 8.683 12,612 672 Operating income Other income (expense), net Income before provision for income taxes Provision for income taxes Net income 11,544 367 11,911 1,867 10.044 $ 48,305 1,305 49,610 8,040 41,570 S 54.780 1,702 56,482 11,076 13,284 1,765 11,519 $ 45,406 $ $ 2.20 $ 2.18 $ 236 $ 2.34 $ 8.92 $ 8.86 $ 9.07 8.99 Earnings per share: Basic Diluted Shares used in computing earnings per share: Basic Diluted 4,570,633 4,601,380 4,882,167 4,926,609 4,660,175 4,691,759 5,006,640 5,050,963 S Net sales by reportable segment: Americas Europe Greater China Japan Rest of Asia Pacific Total net sales 25,056 S 11,925 9.157 4,082 3,589 53,809 $ 24,542 $ 12,138 9,551 3,867 3,167 53,265 $ 87,592 $ 45,342 32,544 16,524 14,132 196,134 $ 84,576 47,038 40,531 16,572 13,978 202,695 $ 1) Net sales by category: iPhone Mac iPad Wearables, Home and Accessories Services Total net sales 25,986 s 5,820 5,023 5,525 11,455 53.809 $ 29,470 $ 5,258 4,634 3,733 10,170 53,265 $ 109,019 $ 18,749 16,624 17,962 33,780 196,134 $ 128,133 17,858 14,397 13,158 29,149 202,695 Apple Inc. CONDENSED CONSOLIDATED BALANCE SHEETS (Unaudited) (In millions, except number of shares which are reflected in thousands and par value) June 29, 2019 September 29, 2018 ASSETS: Current assets: Cash and cash equivalents Marketable securities Accounts receivable, net Inventories Vendor non-trade receivables Other current assets Total current assets 50,530 S 44,084 14,148 3,355 12.326 10,530 134,973 25,913 40,388 23,186 3,956 25,809 12,087 131,339 115,99 37,636 33,634 187266 322,239 $ 170,799 41,304 22,283 234,386 365,725 $ Non-current assets: Marketable securities Property, plant and equipment, net Other non-current assets Total non-current assets Total assets LIABILITIES AND SHAREHOLDERS' EQUITY: Current liabilities: Accounts payable Other current liabilities Deferred revenue Commercial paper Term debt Total current liabilities 29,115 $ 31,673 5,434 9,953 13,529 89,704 55,888 33,327 5,966 11,964 8,784 115,929 Non-current liabilities: Term debt Other non-current liabilities Total non-current liabilities Total liabilities 84.936 51.143 136,079 225.783 93,735 48,914 142,649 258,578 Commitments and contingencies Shareholders' equity: Common stock and additional paid-in capital, $0.00001 par value: 12,600,000 shares authorized: 4,531,395 and 4,754,986 shares issued and outstanding, respectively Retained earnings Accumulated other comprehensive Income/floss) Total shareholders' equity Total liabilities and shareholders' equity 43,371 53,724 (639) 96,456 322,239 $ 40,201 70,400 (3.454) 107,147 365,725 Apple Inc. CONDENSED CONSOLIDATED STATEMENTS OF CASH FLOWS (Unaudited) (In millions) Nine Months Ended June 29 June 30, 2019 2018 25.913 $ 20.289 $ 41,570 45,406 9,368 4,569 (38) (340) 8,149 3,995 (33,109) (410) 3,756 9,013 496 13,483 693 (19,804) (776) (8,753) 49,481 (1,114) 5,536 (65) (10,410) (73) 36,250 57,911 Cash, cash equivalents and restricted cash, beginning balances Operating activities: Net income Adjustments to reconcile net income to cash generated by operating activities: Depreciation and amortization Share-based compensation expense Deferred income tax benefit Other Changes in operating assets and liabilities: Accounts receivable, net Inventories Vendor non-trade receivables Other current and non-current assets Accounts payable Deferred revenue Other current and non-current liabilities Cash generated by operating activities Investing activities: Purchases of marketable securities Proceeds from maturities of marketable securities Proceeds from sales of marketable securities Payments for acquisition of property, plant and equipment Payments made in connection with business acquisitions, net Purchases of non-marketable securities Proceeds from non-marketable securities Other Cash generated by investing activities Financing activities Proceeds from issuance of common stock Payments for taxes related to net share settlement of equity awards Payments for dividends and dividend equivalents Repurchases of common stock Proceeds from issuance of term debt, net Repayments of term debt Repayments of commercial paper, net Other Cash used in financing activities Increase in cash, cash equivalents and restricted cash Cash, cash equivalents and restricted cash, ending balances Supplemental cash flow disclosure: Cash paid for income taxes, net Cash paid for interest (21.902) 26,783 49,516 (7,718) (611) (632) 1.526 (268) 46.694 (56,133) 46,290 41,614 (10,272) (431) (1.788) 310 (523) 19,067 391 (2,626) (10,640) (49,453) 328 (2,287) (10,182) (53,634) 6,969 (6,500) (10) (5,500) (2.026) (83) (69.937) 26.238 52,151 $ (65,296) 11,682 31,971 11,795 $ 2,563 $ 8,819 2,120