Answered step by step
Verified Expert Solution
Link Copied!

Question

1 Approved Answer

Guided Exercises 6.30 River Iron. This is an exercise with a moral: Sometimes, the way to tell that your model is wrong requires you to
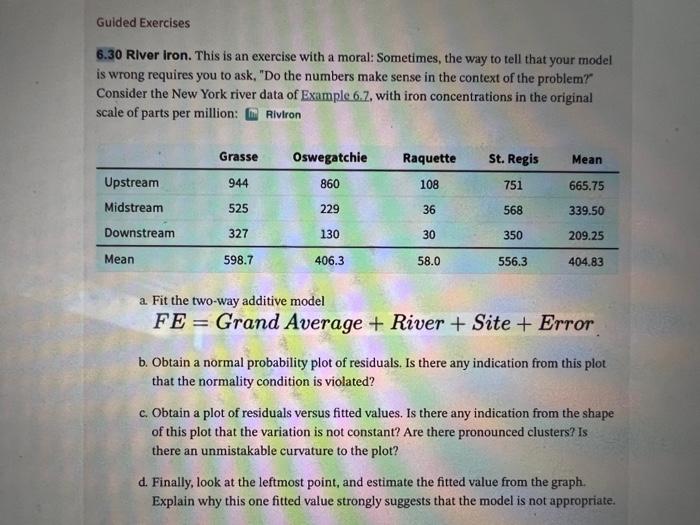
image text in transcribed
Guided Exercises 6.30 River Iron. This is an exercise with a moral: Sometimes, the way to tell that your model is wrong requires you to ask, "Do the numbers make sense in the context of the problem? Consider the New York river data of Example 6.7. with iron concentrations in the original scale of parts per million: Riveron Grasse Oswegatchie Raquette St. Regis Mean 944 860 108 751 665.75 Upstream Midstream 525 229 36 568 339.50 Downstream 327 130 30 350 209.25 Mean 598.7 406.3 58.0 556.3 404.83 a Fit the two-way additive model FE = Grand Average + River + Site + Error b. Obtain a normal probability plot of residuals. Is there any indication from this plot that the normality condition is violated? c. Obtain a plot of residuals versus fitted values. Is there any indication from the shape of this plot that the variation is not constant? Are there pronounced clusters? Is there an unmistakable curvature to the plot? d. Finally, look at the leftmost point, and estimate the fitted value from the graph. Explain why this one fitted value strongly suggests that the model is not appropriate

Step by Step Solution

There are 3 Steps involved in it

Step: 1

blur-text-image

Get Instant Access to Expert-Tailored Solutions

See step-by-step solutions with expert insights and AI powered tools for academic success

Step: 2

blur-text-image

Step: 3

blur-text-image

Ace Your Homework with AI

Get the answers you need in no time with our AI-driven, step-by-step assistance

Get Started

Recommended Textbook for

Handbook Of Communication Audits For Organisations

Authors: Owen D.W. Hargie, Dennis Tourish

1st Edition

0415186420, 978-0415186421

More Books

Students also viewed these Accounting questions