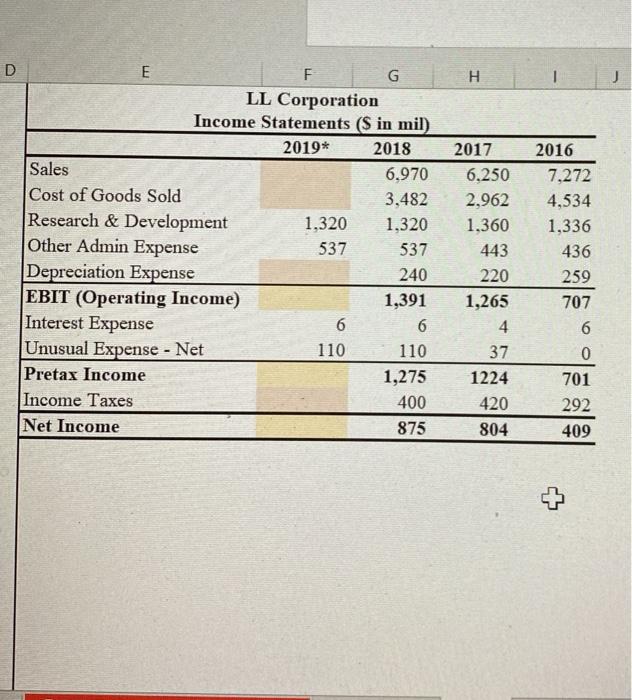
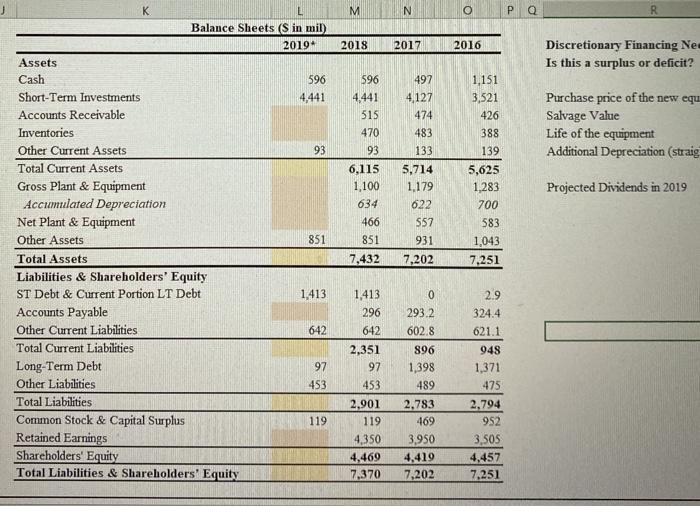
H 1 2016 D E F G LL Corporation Income Statements (S in mil) 2019* 2018 Sales 6.970 Cost of Goods Sold 3,482 Research & Development 1,320 1,320 Other Admin Expense 537 537 Depreciation Expense 240 EBIT (Operating Income) 1,391 Interest Expense 6 6 Unusual Expense - Net 110 110 Pretax Income 1,275 Income Taxes 400 Net Income 875 2017 6.250 2,962 1.360 443 220 1,265 4. 37 1224 420 804 7,272 4,534 1,336 436 259 707 6 0 701 292 409 M N o Q 2018 2017 2016 Discretionary Financing Ne Is this a surplus or deficit? 596 4,441 515 470 93 6,115 1,100 634 466 851 Purchase price of the new equ Salvage Value Life of the equipment Additional Depreciation (straig K Balance Sheets (S in mil) 2019 Assets Cash 596 Short-Term Investments 4,441 Accounts Receivable Inventories Other Current Assets 93 Total Current Assets Gross Plant & Equipment Accumulated Depreciation Net Plant & Equipment Other Assets 851 Total Assets Liabilities & Shareholders' Equity ST Debt & Current Portion LT Debt 1.413 Accounts Payable Other Current Liabilities 642 Total Current Liabilities Long-Term Debt 97 Other Liabilities 453 Total Liabilities Common Stock & Capital Surplus 119 Retained Earnings Shareholders' Equity Total Liabilities & Shareholders' Equity 497 4,127 474 483 133 5,714 1.179 622 S57 931 7,202 1,151 3,521 426 388 139 5,625 1.283 700 583 1,043 7.251 Projected Dividends in 2019 7,432 1,413 296 642 2,351 97 453 2,901 119 4.350 4,469 7,370 0 293.2 602.8 896 1,398 489 2.9 324.4 621.1 948 1,371 475 2,794 952 3.SOS 4,457 7.251 2.783 469 3,950 4.419 7,202 H 1 2016 D E F G LL Corporation Income Statements (S in mil) 2019* 2018 Sales 6.970 Cost of Goods Sold 3,482 Research & Development 1,320 1,320 Other Admin Expense 537 537 Depreciation Expense 240 EBIT (Operating Income) 1,391 Interest Expense 6 6 Unusual Expense - Net 110 110 Pretax Income 1,275 Income Taxes 400 Net Income 875 2017 6.250 2,962 1.360 443 220 1,265 4. 37 1224 420 804 7,272 4,534 1,336 436 259 707 6 0 701 292 409 M N o Q 2018 2017 2016 Discretionary Financing Ne Is this a surplus or deficit? 596 4,441 515 470 93 6,115 1,100 634 466 851 Purchase price of the new equ Salvage Value Life of the equipment Additional Depreciation (straig K Balance Sheets (S in mil) 2019 Assets Cash 596 Short-Term Investments 4,441 Accounts Receivable Inventories Other Current Assets 93 Total Current Assets Gross Plant & Equipment Accumulated Depreciation Net Plant & Equipment Other Assets 851 Total Assets Liabilities & Shareholders' Equity ST Debt & Current Portion LT Debt 1.413 Accounts Payable Other Current Liabilities 642 Total Current Liabilities Long-Term Debt 97 Other Liabilities 453 Total Liabilities Common Stock & Capital Surplus 119 Retained Earnings Shareholders' Equity Total Liabilities & Shareholders' Equity 497 4,127 474 483 133 5,714 1.179 622 S57 931 7,202 1,151 3,521 426 388 139 5,625 1.283 700 583 1,043 7.251 Projected Dividends in 2019 7,432 1,413 296 642 2,351 97 453 2,901 119 4.350 4,469 7,370 0 293.2 602.8 896 1,398 489 2.9 324.4 621.1 948 1,371 475 2,794 952 3.SOS 4,457 7.251 2.783 469 3,950 4.419 7,202


