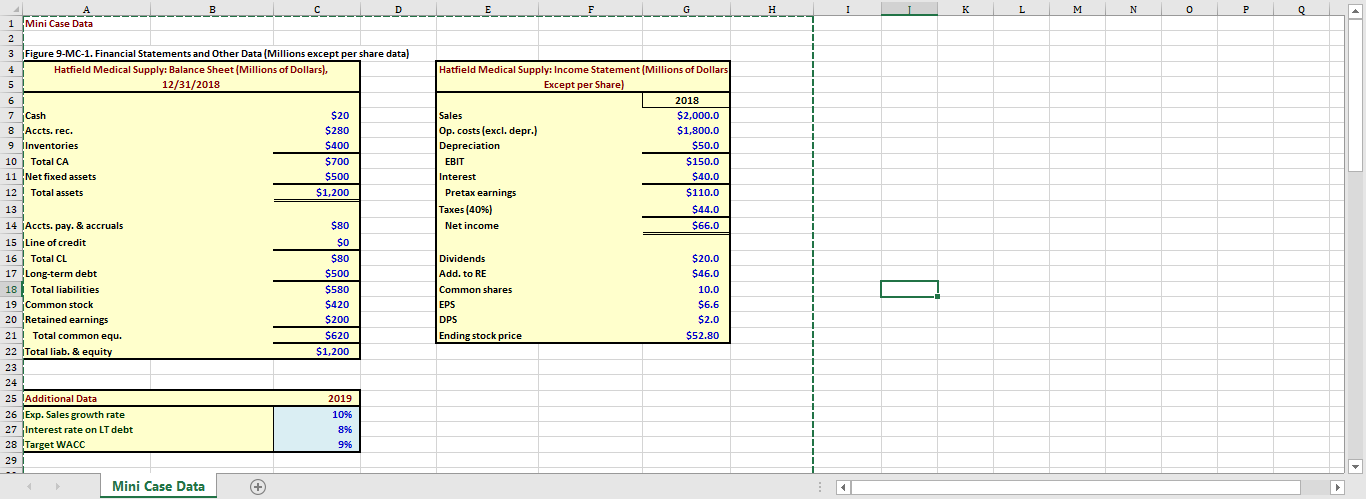
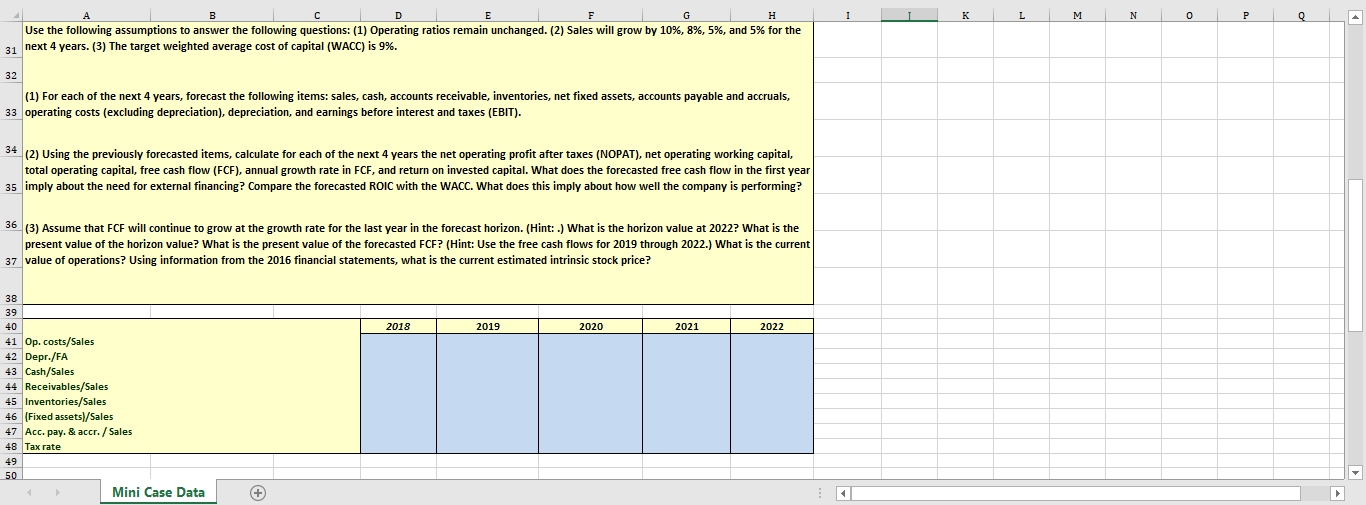
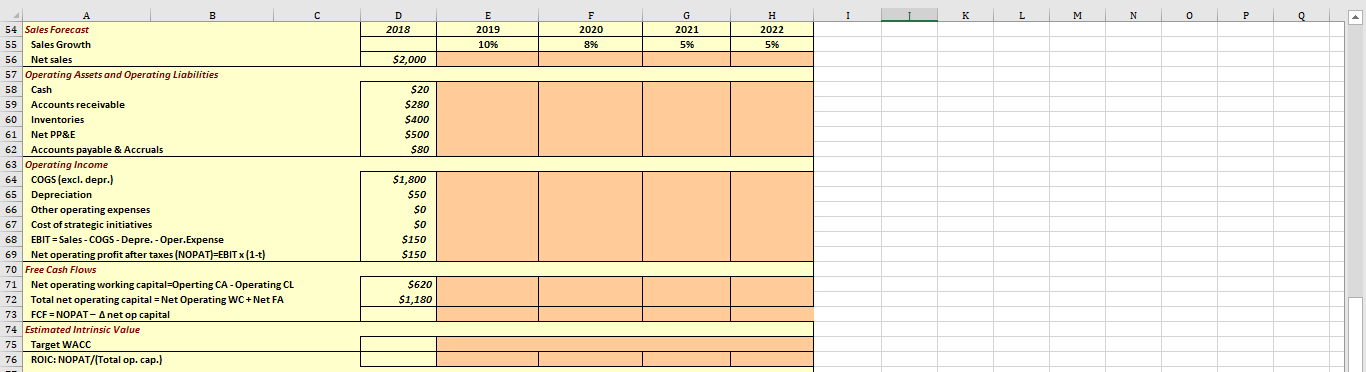
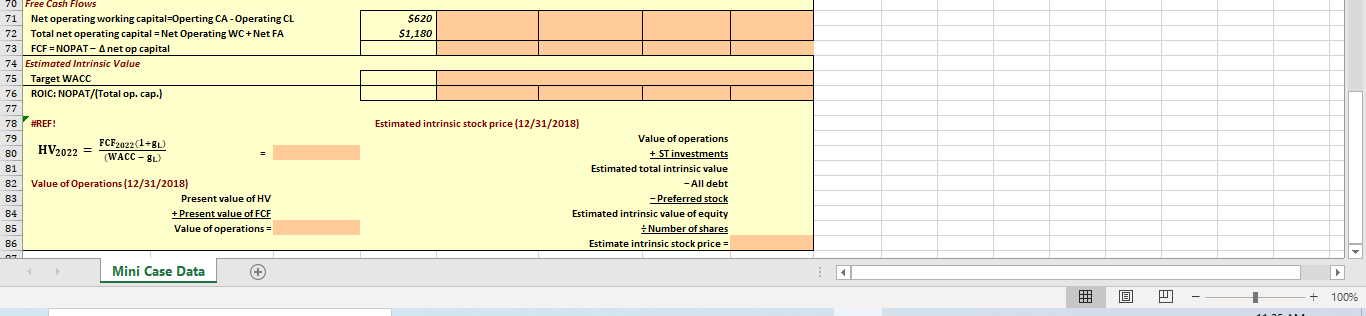
H I L M N o P Q 1 1 Hatfield Medical Supply: Income Statement (Millions of Dollars Except per Share) 2018 Sales $2,000.0 Op.costs (excl. depr.) $1,800.0 Depreciation $50.0 EBIT $150.0 Interest $40.0 Pretax earnings $110.0 Taxes (40%) $44.0 Not Net income $ 1 $66.0 D 1 Mini Case Data 2 3 Figure 9-MC-1. Financial Statements and Other Data Millions except per share data) 4 Hatfield Medical Supply: Balance Sheet (Millions of Dollars), 5 12/31/2018 6 7 Cash $20 8 Accts. rec. $280 9 Inventories $400 10Total CA $700 11 Net fixed assets $500 1 12 Total assets $1,200 13 14 Accts.pay. & accruals $80 15 Line of credit $0 16 TotalCL $80 17 17 Long-term debt $500 18 Total liabilities $580 19 Common stock $420 20 Retained earnings $200 21! Total common equ. $620 22 Total liab. & equity $1,200 23 24 25 Additional Data 2019 26 Exp. Sales growth rate 10% 27 Interest rate on LT debt 896 28 Target WACC 9% 29 Dividends Add. to RE Common shares EPS DPS Ending stock price $20.0 $46.0 10.0 $6.6 $2.0 $52.80 1 1 Mini Case Data (+ D E L M N 0 P Use the following assumptions to answer the following questions: (1) Operating ratios remain unchanged. (2) Sales will grow by 10%, 8%, 5%, and 5% for the 31 next 4 years. (3) The target weighted average cost of capital (WACC) is 9%. 32 (1) For each of the next 4 years, forecast the following items: sales, cash, accounts receivable, inventories, net fixed assets, accounts payable and accruals, 33 operating costs (excluding depreciation), depreciation, and earnings before interest and taxes (EBIT). 34 (2) Using the previously forecasted items, calculate for each of the next 4 years the net operating profit after taxes (NOPAT), net operating working capital, total operating capital, free cash flow (FCF), annual growth rate in FCF, and return on invested capital. What does the forecasted free cash flow in the first year 35 imply about the need for external financing? Compare the forecasted ROIC with the WACC. What does this imply about how well the company is performing? 36 (3) Assume that FCF will continue to grow at the growth rate for the last year in the forecast horizon. (Hint: .) What is the horizon value at 2022? What is the present value of the horizon value? What is the present value of the forecasted FCF? (Hint: Use the free cash flows for 2019 through 2022.) What is the current 37 value of operations? Using information from the 2016 financial statements, what is the current estimated intrinsic stock price? 2018 2019 2020 2021 2022 38 39 40 41 Op. costs/Sales 42 Depr./FA 43 Cash/Sales 44 Receivables/Sales 45 Inventories/Sales 46 (Fixed assets/Sales 47 Acc. pay. & accr. / Sales 48 Tax rate 49 50 Mini Case Data + E F I L M N 0 P Q D 2018 2019 2020 G 2021 596 H 2022 5% 10% 896 $2,000 $20 $280 $400 $500 $80 B 54 Sales Forecast 55 Sales Growth 56 Net sales 57 Operating Assets and Operating Liabilities 58 Cash 59 Accounts receivable 60 Inventories 61 Net PP&E 62 Accounts payable & Accruals 63 Operating Income 64 COGS (excl. depr.) 65 Depreciation 66 Other operating expenses 67 Cost of strategic initiatives 68 EBIT = Sales - COGS - Depre. - Oper. Expense 69 Net operating profit after taxes (NOPAT)=EBIT X (1-t) 70 Free Cash Flows 71 Net operating working capital=Operting CA - Operating CL 72 Total net operating capital = Net Operating WC+ Net FA 73 FCF = NOPAT-A net op capital 74 Estimated Intrinsic Value 75 Target WACC 76 ROIC: NOPAT/(Total op. cap.) $1,800 $50 SO SO $150 $150 $620 $1,180 5620 $1,180 70 Free Cash Flows 71 Net operating working capital=Operting CA - Operating CL 72 Total net operating capital = Net Operating WC+Net FA 73 FCF = NOPAT-A net op capital 74 Estimated Intrinsic Value 75 Target WACC 76 ROIC: NOPAT/(Total op. cap.) 77 78 #REF! 79 FCF2022(1+80) 80 HV2022 = (WACC -9) 81 82 Value of Operations (12/31/2018) 83 Present value of HV 84 + Present value of FCF 85 Value of operations = 86 Estimated intrinsic stock price (12/31/2018) Value of operations + ST investments Estimated total intrinsic value - All debt - Preferred stock Estimated intrinsic value of equity : Number of shares + Estimate intrinsic stock price = Mini Case Data u @ + 100% ar H I L M N o P Q 1 1 Hatfield Medical Supply: Income Statement (Millions of Dollars Except per Share) 2018 Sales $2,000.0 Op.costs (excl. depr.) $1,800.0 Depreciation $50.0 EBIT $150.0 Interest $40.0 Pretax earnings $110.0 Taxes (40%) $44.0 Not Net income $ 1 $66.0 D 1 Mini Case Data 2 3 Figure 9-MC-1. Financial Statements and Other Data Millions except per share data) 4 Hatfield Medical Supply: Balance Sheet (Millions of Dollars), 5 12/31/2018 6 7 Cash $20 8 Accts. rec. $280 9 Inventories $400 10Total CA $700 11 Net fixed assets $500 1 12 Total assets $1,200 13 14 Accts.pay. & accruals $80 15 Line of credit $0 16 TotalCL $80 17 17 Long-term debt $500 18 Total liabilities $580 19 Common stock $420 20 Retained earnings $200 21! Total common equ. $620 22 Total liab. & equity $1,200 23 24 25 Additional Data 2019 26 Exp. Sales growth rate 10% 27 Interest rate on LT debt 896 28 Target WACC 9% 29 Dividends Add. to RE Common shares EPS DPS Ending stock price $20.0 $46.0 10.0 $6.6 $2.0 $52.80 1 1 Mini Case Data (+ D E L M N 0 P Use the following assumptions to answer the following questions: (1) Operating ratios remain unchanged. (2) Sales will grow by 10%, 8%, 5%, and 5% for the 31 next 4 years. (3) The target weighted average cost of capital (WACC) is 9%. 32 (1) For each of the next 4 years, forecast the following items: sales, cash, accounts receivable, inventories, net fixed assets, accounts payable and accruals, 33 operating costs (excluding depreciation), depreciation, and earnings before interest and taxes (EBIT). 34 (2) Using the previously forecasted items, calculate for each of the next 4 years the net operating profit after taxes (NOPAT), net operating working capital, total operating capital, free cash flow (FCF), annual growth rate in FCF, and return on invested capital. What does the forecasted free cash flow in the first year 35 imply about the need for external financing? Compare the forecasted ROIC with the WACC. What does this imply about how well the company is performing? 36 (3) Assume that FCF will continue to grow at the growth rate for the last year in the forecast horizon. (Hint: .) What is the horizon value at 2022? What is the present value of the horizon value? What is the present value of the forecasted FCF? (Hint: Use the free cash flows for 2019 through 2022.) What is the current 37 value of operations? Using information from the 2016 financial statements, what is the current estimated intrinsic stock price? 2018 2019 2020 2021 2022 38 39 40 41 Op. costs/Sales 42 Depr./FA 43 Cash/Sales 44 Receivables/Sales 45 Inventories/Sales 46 (Fixed assets/Sales 47 Acc. pay. & accr. / Sales 48 Tax rate 49 50 Mini Case Data + E F I L M N 0 P Q D 2018 2019 2020 G 2021 596 H 2022 5% 10% 896 $2,000 $20 $280 $400 $500 $80 B 54 Sales Forecast 55 Sales Growth 56 Net sales 57 Operating Assets and Operating Liabilities 58 Cash 59 Accounts receivable 60 Inventories 61 Net PP&E 62 Accounts payable & Accruals 63 Operating Income 64 COGS (excl. depr.) 65 Depreciation 66 Other operating expenses 67 Cost of strategic initiatives 68 EBIT = Sales - COGS - Depre. - Oper. Expense 69 Net operating profit after taxes (NOPAT)=EBIT X (1-t) 70 Free Cash Flows 71 Net operating working capital=Operting CA - Operating CL 72 Total net operating capital = Net Operating WC+ Net FA 73 FCF = NOPAT-A net op capital 74 Estimated Intrinsic Value 75 Target WACC 76 ROIC: NOPAT/(Total op. cap.) $1,800 $50 SO SO $150 $150 $620 $1,180 5620 $1,180 70 Free Cash Flows 71 Net operating working capital=Operting CA - Operating CL 72 Total net operating capital = Net Operating WC+Net FA 73 FCF = NOPAT-A net op capital 74 Estimated Intrinsic Value 75 Target WACC 76 ROIC: NOPAT/(Total op. cap.) 77 78 #REF! 79 FCF2022(1+80) 80 HV2022 = (WACC -9) 81 82 Value of Operations (12/31/2018) 83 Present value of HV 84 + Present value of FCF 85 Value of operations = 86 Estimated intrinsic stock price (12/31/2018) Value of operations + ST investments Estimated total intrinsic value - All debt - Preferred stock Estimated intrinsic value of equity : Number of shares + Estimate intrinsic stock price = Mini Case Data u @ + 100% ar