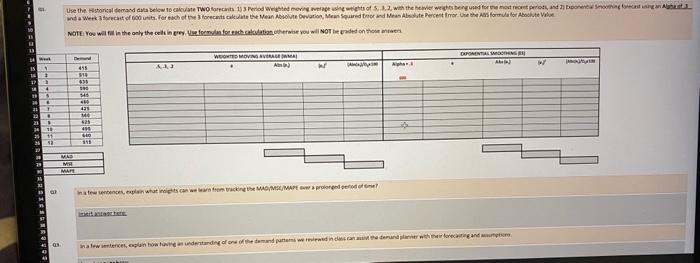
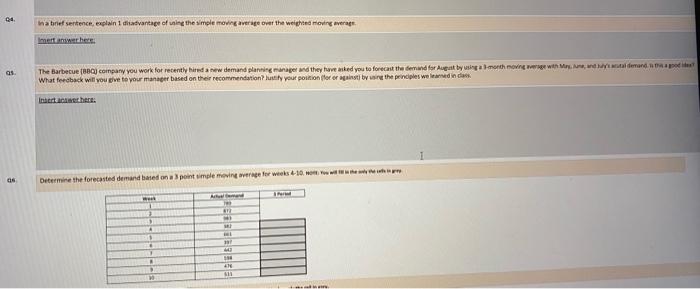
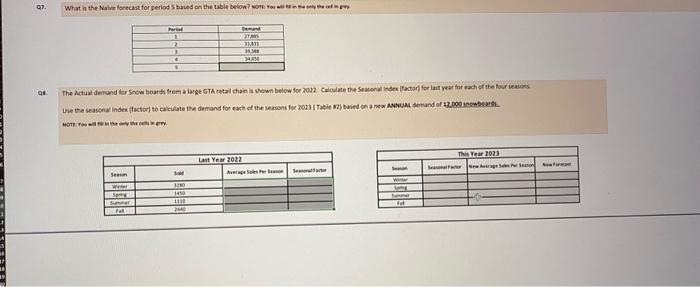
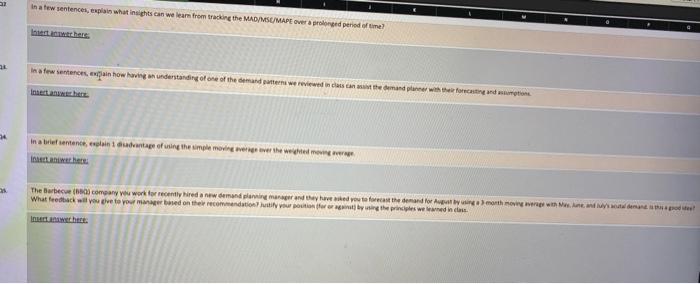
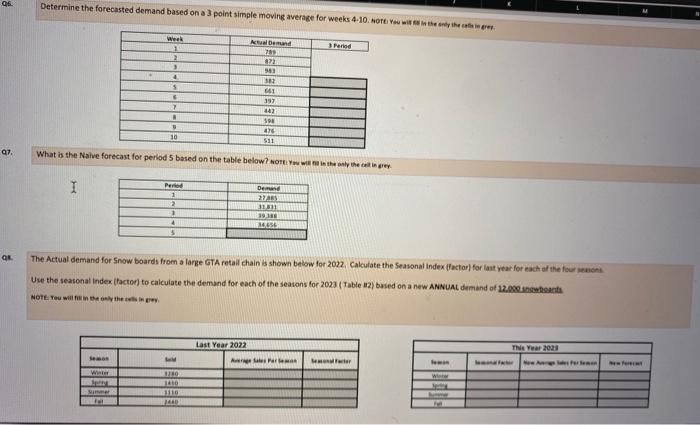
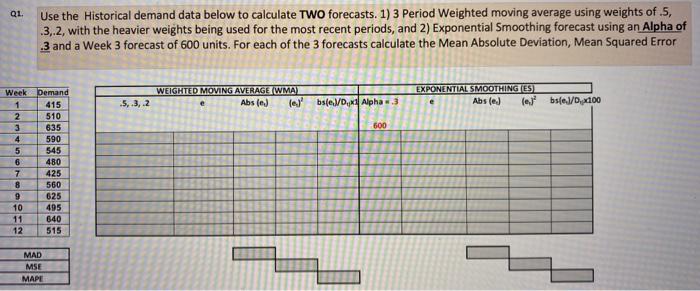
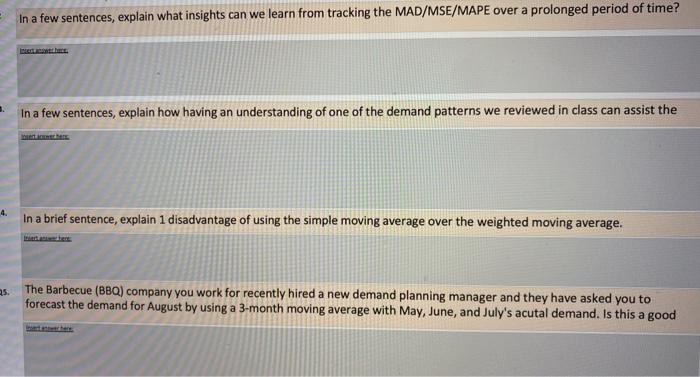
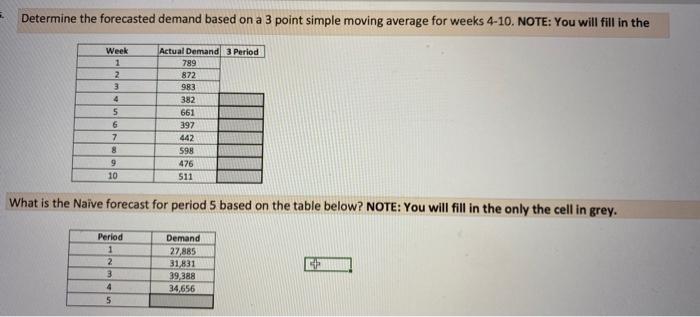
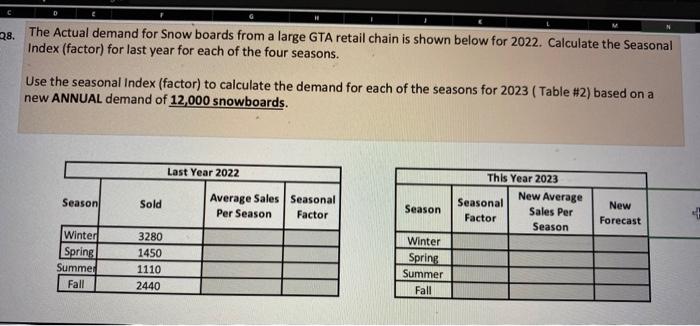
ha brief sertence, explain 1 diiadvartage of ualee the s mele moving average ovet the weighted moving average. Imerf amsarhere: The Barbecue fBecj coinpany you work for recently Bired a niw demand planing funager and they fyve aiked yeu ta forecant the den What feeeback will vou elve to your manager based on their recommendation? lute fy yout poinion llot of againsti by asine the principh intertalestathert. I Se the Historical demand data below to calculate Two torecasts, 1 ) 3 Period Weighted moving average using weights of 5,3,2, weh the hewier weights being used for the most mocest periods and 2) Eipenential Absolute Value. In a few sentences, explais what insights can we learn from trackine the MAoplsc/MApE over a proloneed period of ume? litationtioner Intertanstehere In a buief aentence, cablain 1 disadeantage ef uilne the simple morise aveides dier the we-dsed moving arerage: insat aniwer here: Inset asmerhere: Oetermine the forecasted demand based on a 3 point simple moving average for weeks 410, aorti You mis as in bhe selt ihe anti in erep. What is the Naive forecast for period 5 based on the table below? nort yin wis na in the asly the ant in arex. The Actual demand for Snow boards from a large GTA retall chain is shown betoy for 2022, Cakculate the Seavonal index (factor) for last year for each af the four ietichi Nore: reu wal fie in the ably the ith in gity. Use the Historical demand data below to calculate TWO forecasts. 1) 3 Period Weighted moving average using weights of .5, 3.2, with the heavier weights being used for the most recent periods, and 2) Exponential Smoothing forecast using an Alpha of .3 and a Week 3 forecast of 600 units. For each of the 3 forecasts calculate the Mean Absolute Deviation, Mean Squared Error In a few sentences, explain what insights can we learn from tracking the MAD/MSE/MAPE over a prolonged period of time? In a few sentences, explain how having an understanding of one of the demand patterns we reviewed in class can assist the In a brief sentence, explain 1 disadvantage of using the simple moving average over the weighted moving average. The Barbecue (BBQ) company you work for recently hired a new demand planning manager and they have asked you to forecast the demand for August by using a 3-month moving average with May, June, and July's acutal demand. Is this a good Determine the forecasted demand based on a 3 point simple moving average for weeks 4-10. NOTE: You will fill in the What is the Naive forecast for period 5 based on the table below? NOTE: You will fill in the only the cell in grey. The Actual demand for Snow boards from a large GTA retail chain is shown below for 2022 . Calculate the Seasonal Index (factor) for last year for each of the four seasons. Use the seasonal Index (factor) to calculate the demand for each of the seasons for 2023 (Table #2 ) based on a new ANNUAL demand of 12,000 snowboards. ha brief sertence, explain 1 diiadvartage of ualee the s mele moving average ovet the weighted moving average. Imerf amsarhere: The Barbecue fBecj coinpany you work for recently Bired a niw demand planing funager and they fyve aiked yeu ta forecant the den What feeeback will vou elve to your manager based on their recommendation? lute fy yout poinion llot of againsti by asine the principh intertalestathert. I Se the Historical demand data below to calculate Two torecasts, 1 ) 3 Period Weighted moving average using weights of 5,3,2, weh the hewier weights being used for the most mocest periods and 2) Eipenential Absolute Value. In a few sentences, explais what insights can we learn from trackine the MAoplsc/MApE over a proloneed period of ume? litationtioner Intertanstehere In a buief aentence, cablain 1 disadeantage ef uilne the simple morise aveides dier the we-dsed moving arerage: insat aniwer here: Inset asmerhere: Oetermine the forecasted demand based on a 3 point simple moving average for weeks 410, aorti You mis as in bhe selt ihe anti in erep. What is the Naive forecast for period 5 based on the table below? nort yin wis na in the asly the ant in arex. The Actual demand for Snow boards from a large GTA retall chain is shown betoy for 2022, Cakculate the Seavonal index (factor) for last year for each af the four ietichi Nore: reu wal fie in the ably the ith in gity. Use the Historical demand data below to calculate TWO forecasts. 1) 3 Period Weighted moving average using weights of .5, 3.2, with the heavier weights being used for the most recent periods, and 2) Exponential Smoothing forecast using an Alpha of .3 and a Week 3 forecast of 600 units. For each of the 3 forecasts calculate the Mean Absolute Deviation, Mean Squared Error In a few sentences, explain what insights can we learn from tracking the MAD/MSE/MAPE over a prolonged period of time? In a few sentences, explain how having an understanding of one of the demand patterns we reviewed in class can assist the In a brief sentence, explain 1 disadvantage of using the simple moving average over the weighted moving average. The Barbecue (BBQ) company you work for recently hired a new demand planning manager and they have asked you to forecast the demand for August by using a 3-month moving average with May, June, and July's acutal demand. Is this a good Determine the forecasted demand based on a 3 point simple moving average for weeks 4-10. NOTE: You will fill in the What is the Naive forecast for period 5 based on the table below? NOTE: You will fill in the only the cell in grey. The Actual demand for Snow boards from a large GTA retail chain is shown below for 2022 . Calculate the Seasonal Index (factor) for last year for each of the four seasons. Use the seasonal Index (factor) to calculate the demand for each of the seasons for 2023 (Table #2 ) based on a new ANNUAL demand of 12,000 snowboards
