Answered step by step
Verified Expert Solution
Link Copied!

Question

1 Approved Answer

HammerTong Industries (HT Inc.} produces both Hammers and Steel Tongs. HT Inc. has already signed numerous contracts for the coming year of production. However, the

image text in transcribed

image text in transcribed
HammerTong Industries (HT Inc.} produces both Hammers and Steel Tongs. HT Inc. has already signed numerous contracts for the coming year of production. However, the company has not yet assigned production output across its three manufacturing plants [Plant A, Plant B, and Plant C). Each of the manufacturing plants can be used to produce either Hammers or Steel Tongs or some combination of each. Each plant is constrained by a linear PPF and can locate anywhere along their PPF [or interior to the PPF). Plant A can produce a maximum of 600 Hammers or a maximum of 400 Tongs during the coming year. Plant B can produce a maximum of 200 Hammers or a maximum of 400 Tongs during the coming year. Plant C can produce a maximum of 120 Hammers or a maximum of 60 Tongs during the coming year. a. Draw a PPF for each plant, making sure you label everything fully and DO NOT use any abbreviations in your diagram. b. Calculate the opportunity cost of producing one Tong at each ofthe plants. Make sure you show your work and clearly explain the method you are using to determine the opportunity cost. c. If HT Inc. decides to only produce 60 Tongs and uses all other resources to produce Hammers, which plantlsl should be used to produce Tongs? Explain your answer. d. Draw the combined production possibilities frontier (or curve} that HT Inc. faces. Make sure you label everything fully (including points of interest along the combined PPF} and DO NOT use abbreviations in your diagram. e. If HT Inc. decides to produce a total of 440 Tongs, fully indicate the total production of each type of good for each of the manufacturing plants. In this question, you will be analyzing the market for potatoes during one month in the town of Squilax. This is a perfectly competitive market and satisfies our standard assumptions about markets (from Chapter 3}. You have been told that the current equilibrium price for a pound of potatoes is $2.50 and that the current quantality of potatoes sold each month is 120 pounds. a. Draw a graph of the market for potatoes, clearly indicating the current equilibrium values of your variables. Make sure you label everything fully and DO NOT use abbreviations. b. Look at you graph from part a and report a price that would result in a shortage of potatoes in the market. c. Assume that our market was initially in a position of equilibrium but that an agricultural pest begins to invade potatoes being grown, and those potatoes already harvested. The pest does not destroy all potatoes but it does damage some potatoes so they are unfit for consumption. Explain, in detail, what you are likely to observe in the market for potatoes. You may use a graph to help explain your answer, but you must still provide a detailed description (in words)

Step by Step Solution

There are 3 Steps involved in it

Step: 1

blur-text-image

Get Instant Access with AI-Powered Solutions

See step-by-step solutions with expert insights and AI powered tools for academic success

Step: 2

blur-text-image

Step: 3

blur-text-image

Ace Your Homework with AI

Get the answers you need in no time with our AI-driven, step-by-step assistance

Get Started

Recommended Textbook for

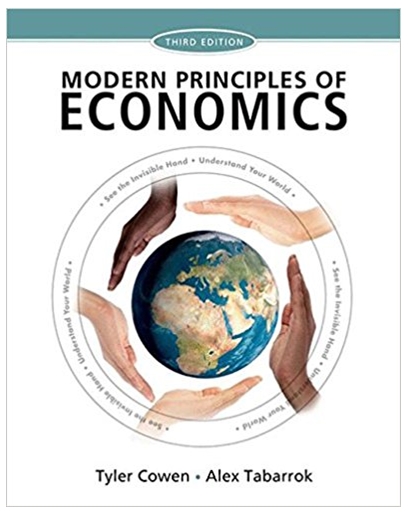
Modern Principles of Economics

Authors: Tyler Cowen, Alex Tabarrok

3rd edition

1429278390, 978-1429278416, 1429278412, 978-1429278393

Students also viewed these Economics questions

Question

1. Keep definitions of key vocabulary available as you study.

Answered: 1 week ago