Answered step by step
Verified Expert Solution
Question
1 Approved Answer
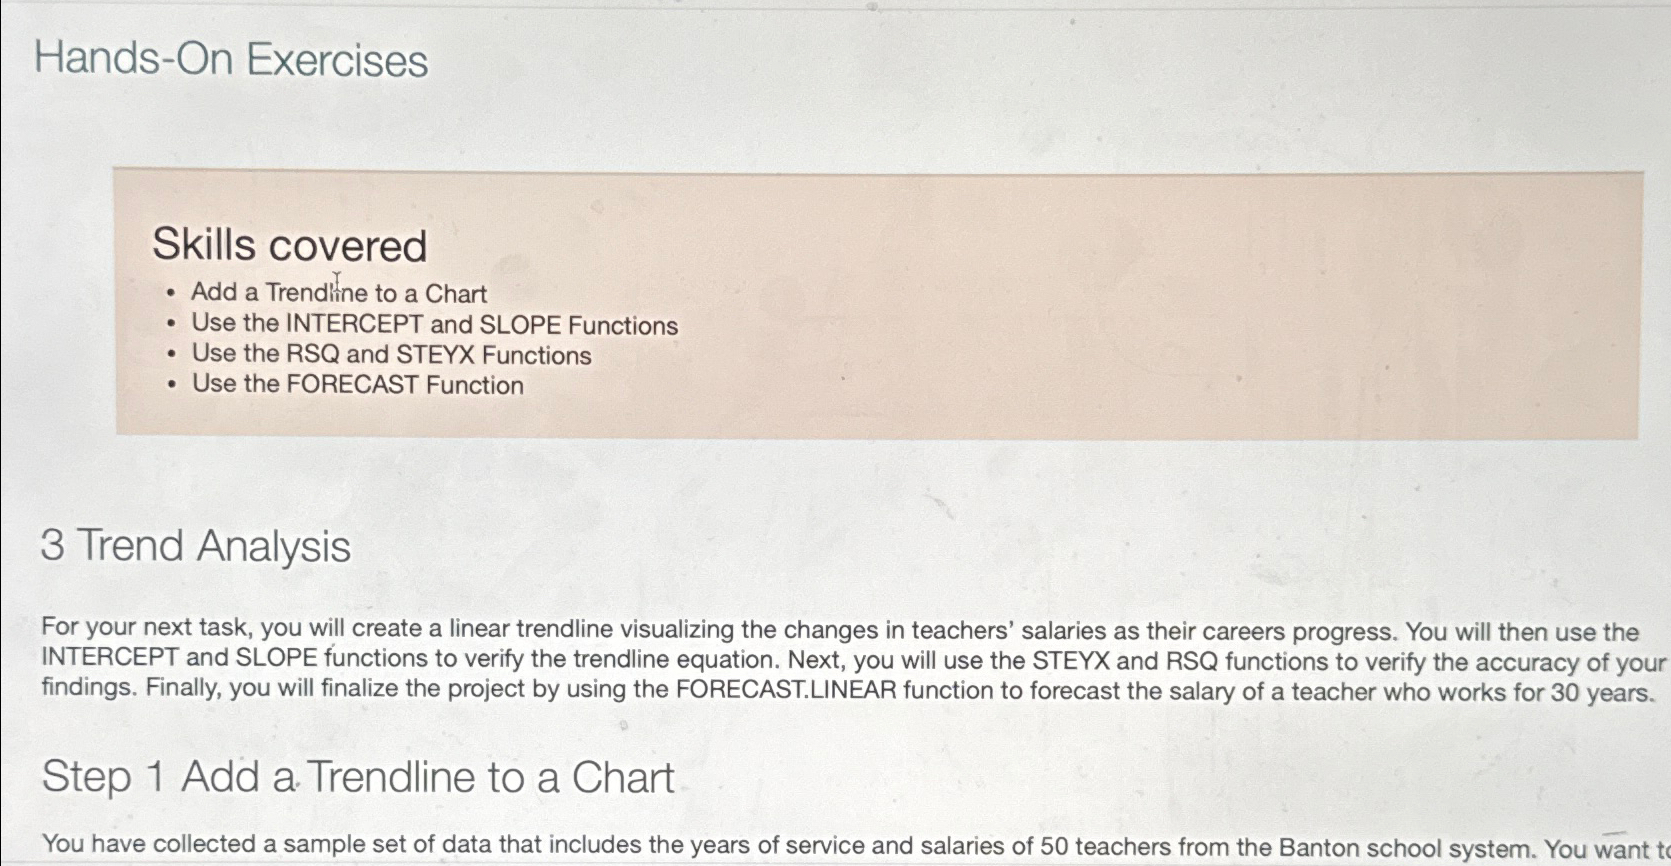
Hands - On Exercises Skills covered Add a Trendline to a Chart Use the INTERCEPT and SLOPE Functions Use the RSQ and STEYX Functions Use
HandsOn Exercises
Skills covered
Add a Trendline to a Chart
Use the INTERCEPT and SLOPE Functions
Use the RSQ and STEYX Functions
Use the FORECAST Function
Trend Analysis
For your next task, you will create a linear trendline visualizing the changes in teachers' salaries as their careers progress. You will then use the INTERCEPT and SLOPE functions to verify the trendline equation. Next, you will use the STEYX and RSQ functions to verify the accuracy of your findings. Finally, you will finalize the project by using the FORECAST.LINEAR function to forecast the salary of a teacher who works for years.
Step Add a Trendline to a Chart
You have collected a sample set of data that includes the years of service and salaries of teachers from the Banton school system. You want to

Step by Step Solution
There are 3 Steps involved in it
Step: 1

Get Instant Access to Expert-Tailored Solutions
See step-by-step solutions with expert insights and AI powered tools for academic success
Step: 2

Step: 3

Ace Your Homework with AI
Get the answers you need in no time with our AI-driven, step-by-step assistance
Get Started


