Answered step by step
Verified Expert Solution
Link Copied!

Question

1 Approved Answer

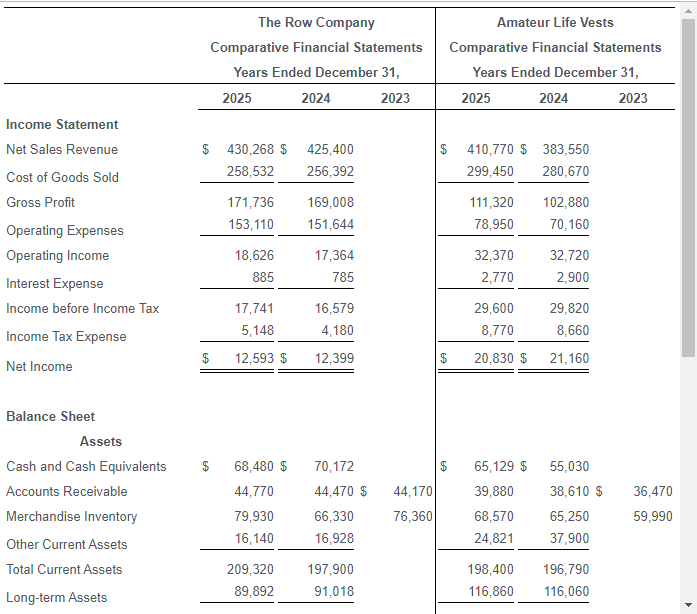
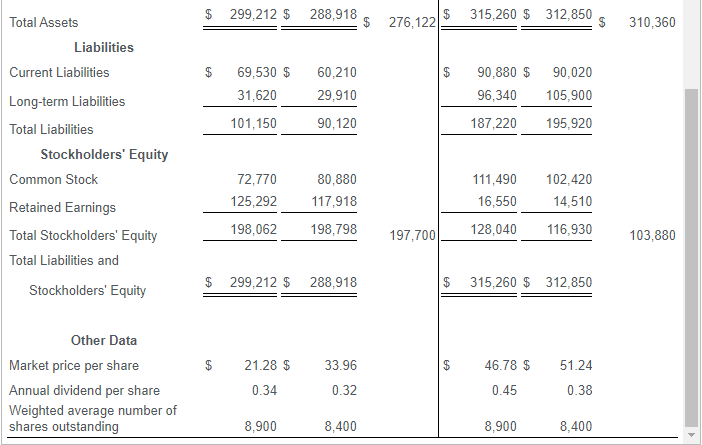
Happy Camper Company question requirements F-I 1. Using the financial statements given, compute the following ratios for both companies for 2025 and 2024. Assume all

Happy Camper Company question requirements F-Iimage text in transcribed

image text in transcribed

image text in transcribed

1. Using the financial statements given, compute the following ratios for both companies for 2025 and 2024. Assume all sales are credit sales. Round all ratios to two decimal places. a. Current ratio b. Cash ratio c. Inventory turnover d. Accounts receivable turnover e. Gross profit percentage f. Debt ratio g. Debt to equity ratio h. Profit margin ratio i. Asset turnover ratio j. Rate of return on common stockholders' equity k. Earnings per share 1. Pricelearnings ratio m. Dividend yield n. Dividend payout 2. Compare the companies' performance for 2025 and 2024. Make a recommendation to Happy Camper Company about investing in these companies. Which company would be a better investment, The Row Company or Amateur Life Vests? Base your answer on ability to pay current liabilities, ability to sell merchandise and collect receivables, ability to pay long-term debt, profitability, and attractiveness as an investment. The Row Company Comparative Financial Statements Years Ended December 31, 2025 2024 2023 Amateur Life Vests Comparative Financial Statements Years Ended December 31, 2025 2024 2023 $ 430,268 $ 425,400 258,532 256,392 410,770 $ 383,550 299,450 280,670 171,736 153,110 169,008 151,644 111,320 78,950 102,880 70,160 Income Statement Net Sales Revenue Cost of Goods Sold Gross Profit Operating Expenses Operating Income Interest Expense Income before Income Tax Income Tax Expense Net Income 18,626 885 17,364 785 32,370 2,770 32,720 2,900 17,741 5,148 16,579 4,180 29,600 8,770 29,820 8,660 $ 12,593 $ 12,399 20,830 $ 21,160 $ 68,480 $ $ 65,129 $ 55,030 44,170 Balance Sheet Assets Cash and Cash Equivalents Accounts Receivable Merchandise Inventory Other Current Assets Total Current Assets Long-term Assets 44,770 79,930 16,140 70,172 44,470 $ 66,330 16,928 39,880 68,570 24,821 76,360 38,610 $ 65,250 37,900 36,470 59,990 209,320 89,892 197,900 91,018 198,400 116,860 196,790 116,060 299,212 $ 288,918 $ 276,122 315,260 $ 312,850 310,360 69,530 $ 31,620 60,210 29,910 90,880 $ 96,340 90,020 105,900 101,150 90,120 187,220 195,920 Total Assets Liabilities Current Liabilities Long-term Liabilities Total Liabilities Stockholders' Equity Common Stock Retained Earnings Total Stockholders' Equity Total Liabilities and Stockholders' Equity 72,770 125,292 80,880 117,918 198,798 111,490 16,550 102,420 14,510 116,930 198,062 197,700 128,040 103,880 $ 299,212 $ 288,918 $ 315,260 $ 312,850 $ 21.28 $ 33.96 46.78 $ 51.24 Other Data Market price per share Annual dividend per share Weighted average number of shares outstanding 0.34 0.32 0.45 0.38 8,900 8,400 8,900 8,400

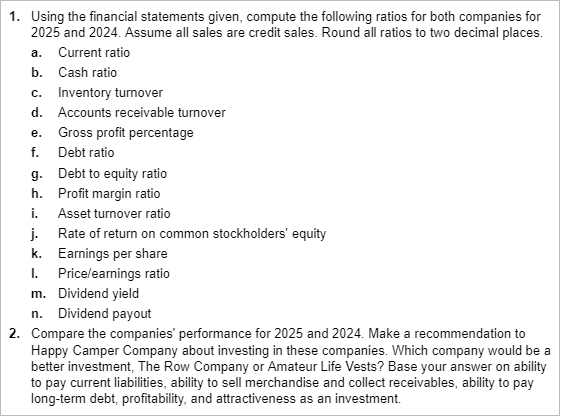
Step by Step Solution

There are 3 Steps involved in it

Step: 1

blur-text-image

Get Instant Access to Expert-Tailored Solutions

See step-by-step solutions with expert insights and AI powered tools for academic success

Step: 2

blur-text-image

Step: 3

blur-text-image

Ace Your Homework with AI

Get the answers you need in no time with our AI-driven, step-by-step assistance

Get Started

Recommended Textbook for

Finance And Security Global Vulnerabilities Threats And Responses

Authors: Martin S. Navias

1st Edition

1787381366, 978-1787381360

More Books

Students also viewed these Finance questions