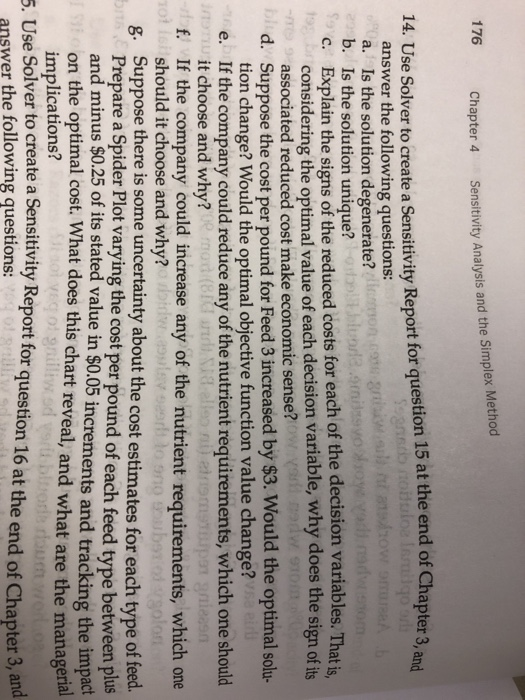
Question: hapter 4 Sensitivity Analysis and the Simplex Method 14. Use Solver to create a Sensitivity Report for question 15 at the end of Chapter 3

hapter 4 Sensitivity Analysis and the Simplex Method 14. Use Solver to create a Sensitivity Report for question 15 at the end of Chapter 3 answer the following questions: a. Is the solution degenerate? b. Is the solution unique? c. Explain the signs of the reduced costs for each of the decision variables. That considering the optimal value of each decision variable, why does the sign of d. Suppose the cost per pound for Feed 3 increased by $3. Would the optimal solu- e. If the company could reduce any of the nutrient requirements, which one should f. If the company could increase any of the nutrient requirements, which one g. Suppose there is some uncertainty about the cost estimates for each type of feed. associated reduced cost make economic sense? tion change? Would the optimal objective function value change? it choose and why? should it choose and why? 19 re a Spider Plot varying the cost per pound of each feed type between plus and minus $0.25 of its stated value in $0.05 increments and tracking the impact on the optimal cost. What does this chart reveal, and what are the manage implications? rial i veg ol gnilliw.sd verab e Solver to create a Sensitivity Report for question 16 at the end of Chapter 3, and answer the following questions: hapter 4 Sensitivity Analysis and the Simplex Method 14. Use Solver to create a Sensitivity Report for question 15 at the end of Chapter 3 answer the following questions: a. Is the solution degenerate? b. Is the solution unique? c. Explain the signs of the reduced costs for each of the decision variables. That considering the optimal value of each decision variable, why does the sign of d. Suppose the cost per pound for Feed 3 increased by $3. Would the optimal solu- e. If the company could reduce any of the nutrient requirements, which one should f. If the company could increase any of the nutrient requirements, which one g. Suppose there is some uncertainty about the cost estimates for each type of feed. associated reduced cost make economic sense? tion change? Would the optimal objective function value change? it choose and why? should it choose and why? 19 re a Spider Plot varying the cost per pound of each feed type between plus and minus $0.25 of its stated value in $0.05 increments and tracking the impact on the optimal cost. What does this chart reveal, and what are the manage implications? rial i veg ol gnilliw.sd verab e Solver to create a Sensitivity Report for question 16 at the end of Chapter 3, and answer the following questions
Step by Step Solution
There are 3 Steps involved in it

Get step-by-step solutions from verified subject matter experts


