

Answered step by step
Verified Expert Solution
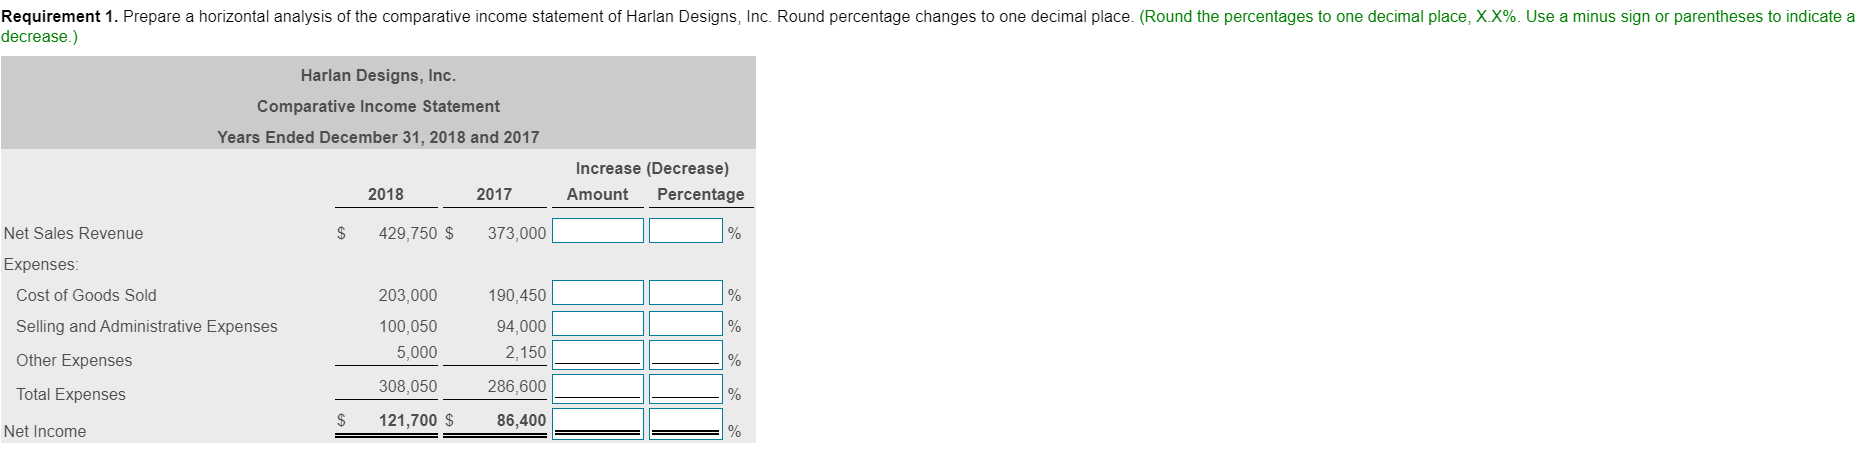
Question
1 Approved Answer
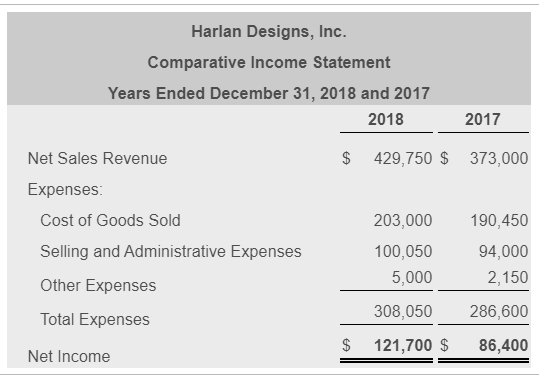
Harlan Designs, Inc. Comparative Income Statement Years Ended December 31, 2018 and 2017 2018 2017 $ 429,750 $ 373,000 Net Sales Revenue Expenses: Cost of

Step by Step Solution
There are 3 Steps involved in it
Step: 1

Get Instant Access to Expert-Tailored Solutions
See step-by-step solutions with expert insights and AI powered tools for academic success
Step: 2

Step: 3
Ace Your Homework with AI
Get the answers you need in no time with our AI-driven, step-by-step assistance
Get Started
The Training And Development Audit
Authors: Rosemary Harrison
2nd Edition
0955970725, 978-0955970726