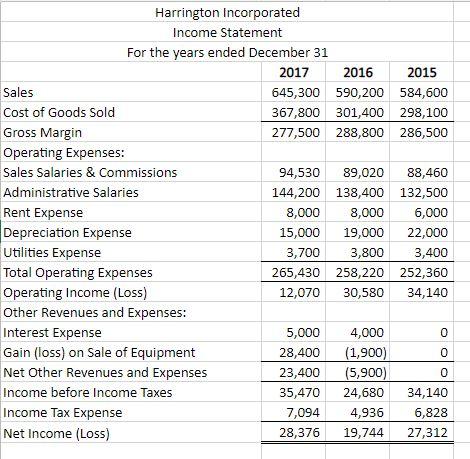
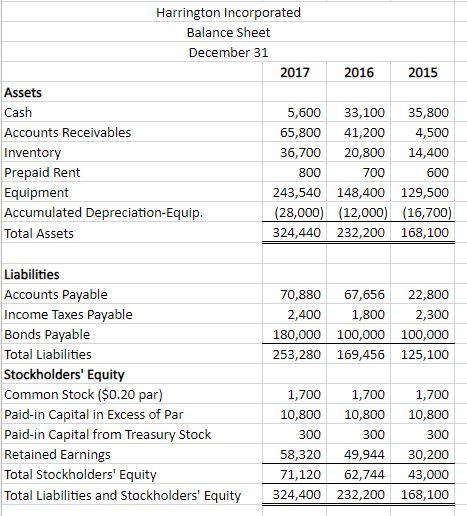
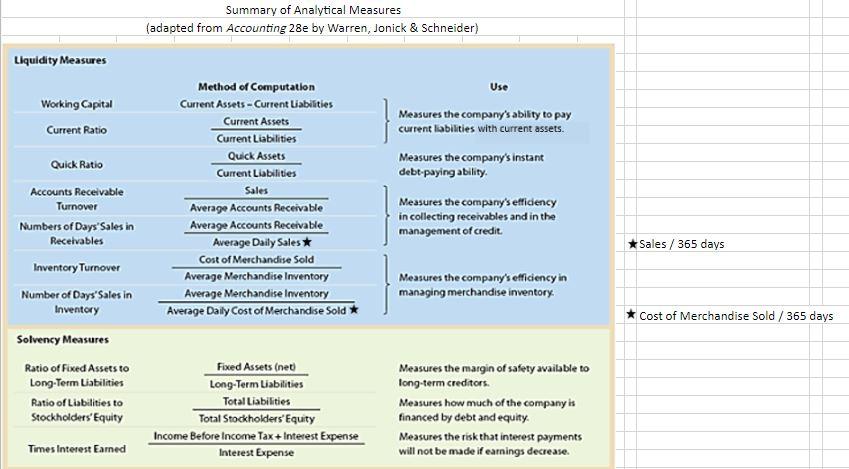
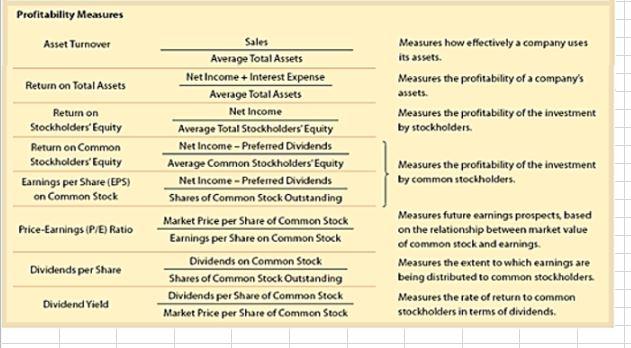
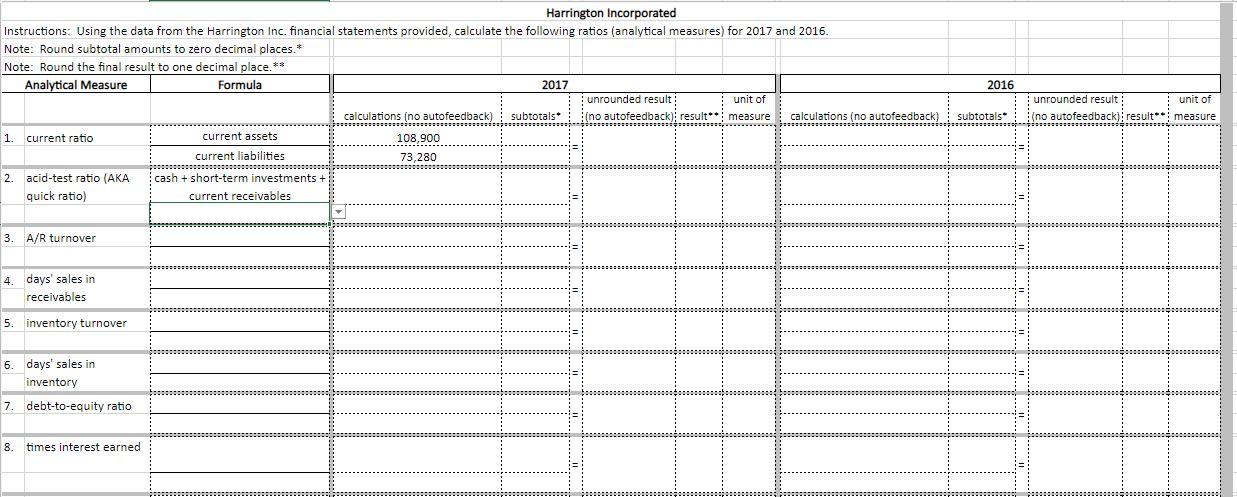
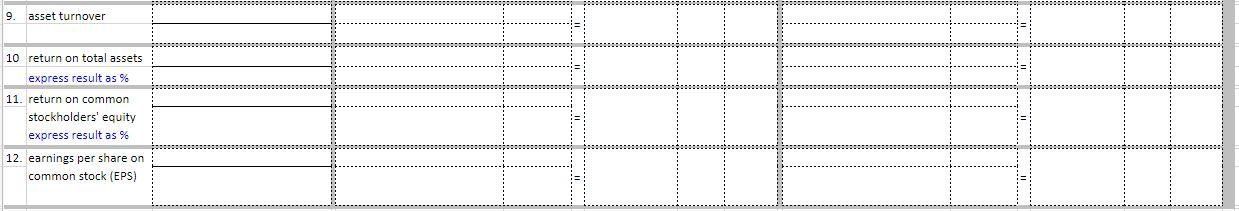
Harrington Incorporated Income Statement For the years ended December 31 2017 2016 2015 Sales 645,300 590,200 584,600 Cost of Goods Sold 367,800 301,400 298,100 Gross Margin 277,500 288,800 286,500 Operating Expenses: Sales Salaries & Commissions 94,530 89,020 88,460 Administrative Salaries 144,200 138,400 132,500 Rent Expense 8,000 8,000 6,000 Depreciation Expense 15,000 19,000 22,000 Utilities Expense 3,700 3,800 3,400 Total Operating Expenses 265,430 258,220 252,360 Operating Income (Loss) 12,070 30,580 34,140 Other Revenues and Expenses: Interest Expense 5,000 4,000 0 Gain (loss) on Sale of Equipment 28,400 (1,900) 0 Net Other Revenues and Expenses 23,400 (5,900) 0 Income before Income Taxes 35,470 24,680 34,140 Income Tax Expense 7,094 4,936 6,828 Net Income (Loss) 28,376 19,744 27,312 Harrington Incorporated Balance Sheet December 31 2017 2016 2015 Assets Cash 5,600 33,100 35,800 Accounts Receivables 65,800 41,200 4,500 Inventory 36,700 20,800 14,400 Prepaid Rent 800 700 600 Equipment 243,540 148,400 129,500 Accumulated Depreciation-Equip. (28,000) (12,000) (16,700) Total Assets 324,440 232,200 168,100 70,880 67,656 22,800 2,400 1,800 2,300 180,000 100,000 100,000 253,280 169,456 125,100 Liabilities Accounts Payable Income Taxes Payable Bonds Payable Total Liabilities Stockholders' Equity Common Stock ($0.20 par) Paid-in Capital in Excess of Par Paid-in Capital from Treasury Stock Retained Earnings Total Stockholders' Equity Total Liabilities and Stockholders' Equity 1,700 1,700 1,700 10,800 10,800 10,800 300 300 300 58,320 49,944 30,200 71,120 62,744 43,000 324,400 232,200 168,100 Summary of Analytical Measures (adapted from Accounting 28e by Warren, Jonick & Schneider) Liquidity Measures Use Working Capital Current Ratio Measures the company's ability to pay current labilities with current assets. Measures the company's instant debt-paying ability Quick Ratio Accounts Receivable Turnover Numbers of Days' Sales in Receivables Inventory Turnover Number of Days Sales in Inventory Method of Computation Current Assets - Current Liabilities Current Assets Current Liabilities Quick Assets Current Liabilities Sales Average Accounts Receivable Average Accounts Receivable Average Daily Sales Cost of Merchandise Sold Average Merchandise Inventory Average Merchandise Inventory Average Daily Cost of Merchandise Sold Measures the company's efficiency in collecting receivables and in the management of credit Sales / 365 days Measures the company's efficiency in managing merchandise inventory. Cost of Merchandise Sold / 365 days Solvency Measures Ratio of Fixed Assets to Long-Term Liabilities Ratio of Liabilities to Stockholders' Equity Fixed Assets (net Long-Term Liabilities Total Liabilities Total Stockholders' Equity Income Before Income Tax +Interest Expense Interest Expense Measures the margin of safety available to long-term creditors. Measures how much of the company is financed by debt and equity Measures the risk that interest payments will not be made if earnings decrease. Times Interest Eamed Profitability Measures Asset Turnover Measures how effectively a company uses Measures the profitability of a company's assets. Measures the profitability of the investment by stockholders Return on Total Assets Return on Stockholders' Equity Return on Common Stockholders' Equity Earnings per Share (EPS) on Common Stock Sales Average Total Assets Net Income + Interest Expense Average Total Assets Net Income Average Total Stockholders' Equity Net Income - Preferred Dividends Average Common Stockholders' Equity Net Income - Preferred Dividends Shares of Common Stock Outstanding Market Pike per Share of Common Stock Earnings per Share on Common Stock Dividends on Common Stock Shares of Common Stock Outstanding Dividends per Share of Common Stock Market Price per Share of Common Stock Measures the profitability of the investment by common stockholders Price-Earnings (P/E) Ratio Dividends per Share Measures future earnings prospects, based on the relationship between market value of common stock and earnings Measures the extent to which earnings are being distributed to common stockholders Measures the rate of return to common stockholders in terms of dividends. Dividend Yield 2016 Harrington Incorporated Instructions: Using the data from the Harrington Inc. financial statements provided, calculate the following ratios (analytical measures) for 2017 and 2016. Note: Round subtotal amounts to zero decimal places.* Note: Round the final result to one decimal place.** Analytical Measure Formula 2017 unrounded result: unit of calculations ino autofeedback) ino autofeedback) result measure calculations (no autofeedback) 1. current ratio current assets 108,900 ...... current liabilities 73,280 .................... 2 acid-test ratio (AKA cash + short-term investments + quick ratio) current receivables unrounded result: unit of (no autofeedback);result** measure 3. A/R turnover 4. days' sales in receivables 5. inventory turnover 6. days' sales in inventory 7 debt-to-equity ratio 8 times interest earned 9. asset turnover 10 return on total assets express result as % 11. return on common stockholders' equity express result as % 12. earnings per share on common stock (EPS)