

Question
Harris asked his financial advisors to determine the financing options for the acquisition. His advisors suggested two alternatives: 100% debt financing, or a mix of
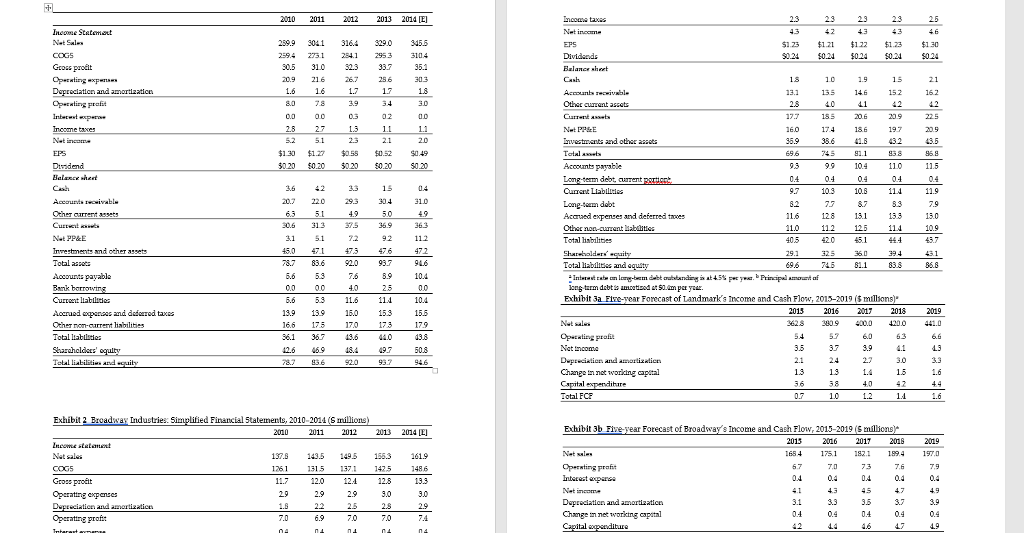
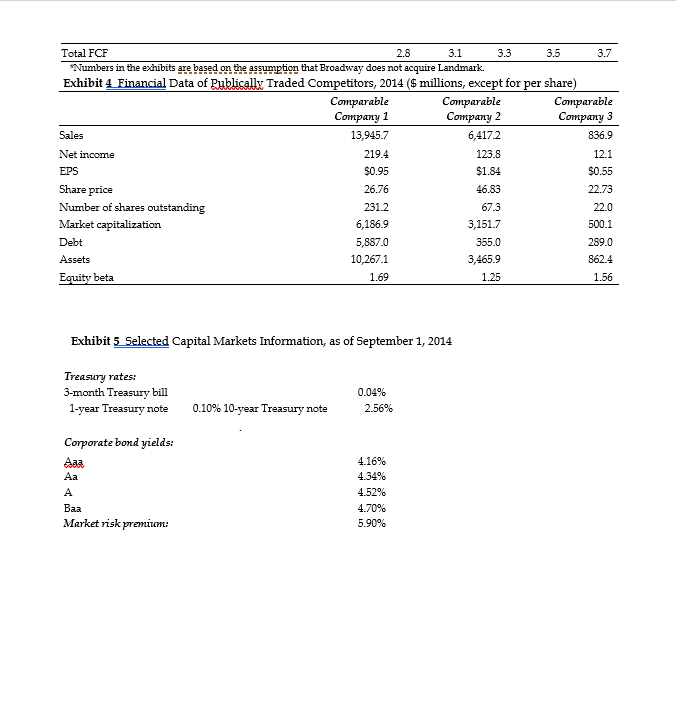
Harris asked his financial advisors to determine the financing options for the acquisition. His advisors suggested two alternatives: 100% debt financing, or a mix of debt and equity financing. The $120 million, all-debt financing would be arranged by Stanley Investment Company, through a syndicated loan package. This loan would carry 5.5% annual interest and mature at the end of 2023. The loan principal would be amortized at the rate of $5 million a year, for six years, starting in 2017, and the final payment of $90 million would be made at loan maturity. This loan would be collateralized by all the assets of the combined firm. Under the alternative plan, a group of investors would provide $60 million each in loans and equity. The loan would carry a 5% interest rate and mature at the end of year 2020. The loan principal of $60 million would be due in its entirety upon maturity. This debt also would be collateralized by all the assets of the combined firm. The equity investment would be provided in exchange for 40% equity ownership in the combined firm. New equity holders would not be entitled to receive dividends until the debt principal was paid in full.
Harris wondered which direction he should take the company he had started more than 30 years ago. He was confident that Landmark would be a strong addition to Broadway, but he also sensed concern from his team of financial advisors and reluctance from his fellow board members at Broadway. Could he justify meeting the purchase price demanded by Landmark? If he made the acquisition, what would be the best way to finance the transaction to ensure the viability of Landmark and maximize the value to Broadway?
QUESTION: Apply the discounted cash flow approach using WACC and project the Free Cash Flows (FCFs) to evaluate an acquisition opportunity. For the next five years starting form 2019
Step by Step Solution
There are 3 Steps involved in it
Step: 1

Get Instant Access to Expert-Tailored Solutions
See step-by-step solutions with expert insights and AI powered tools for academic success
Step: 2

Step: 3
Ace Your Homework with AI
Get the answers you need in no time with our AI-driven, step-by-step assistance
Get Started
Behavioral Finance And Investor Types
Authors: Michael M. Pompian
1st Edition
1118011503, 978-1118011508