

Answered step by step
Verified Expert Solution
Question
1 Approved Answer
Harrison Products Inc. (HPI) is a global manufacturer of molded plastic products and metal products that are used in the auto industry, food and beverage
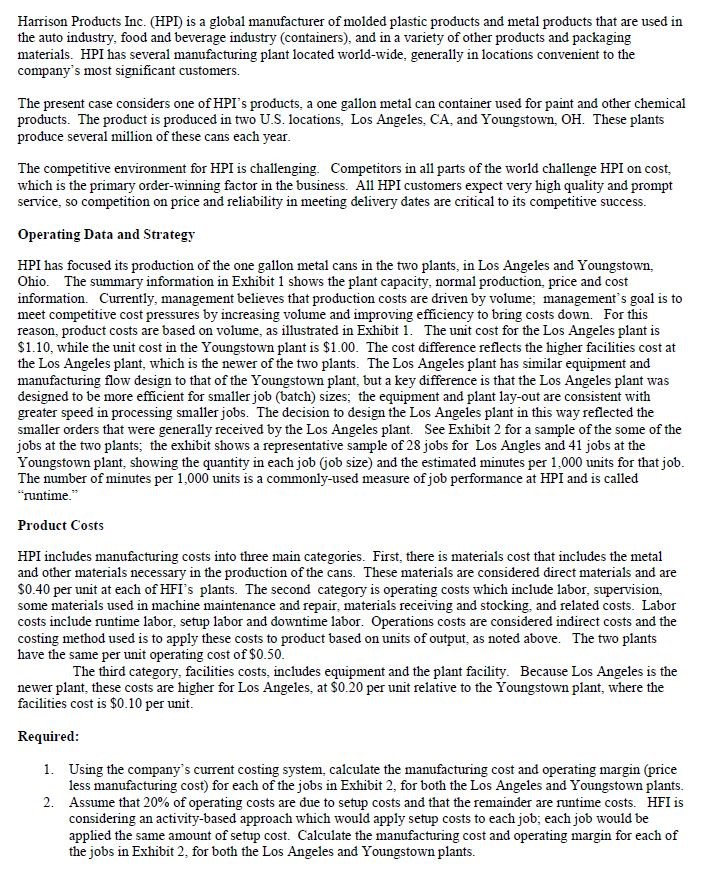
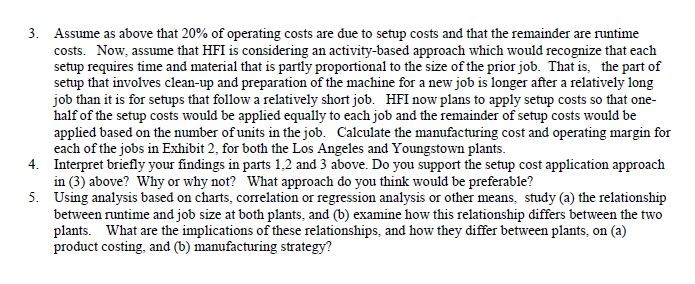
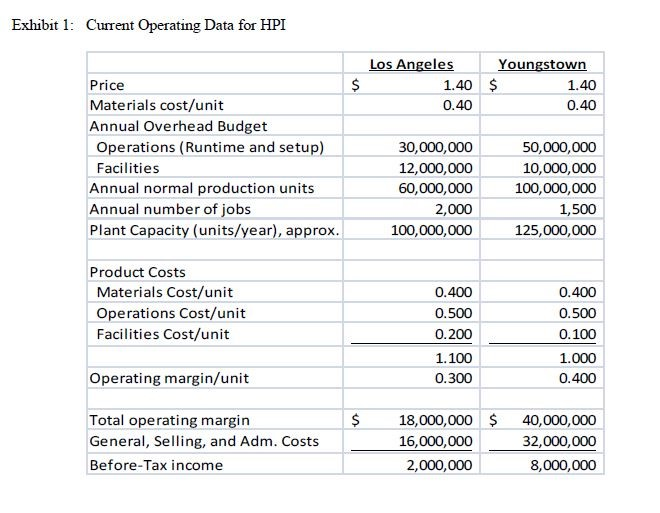
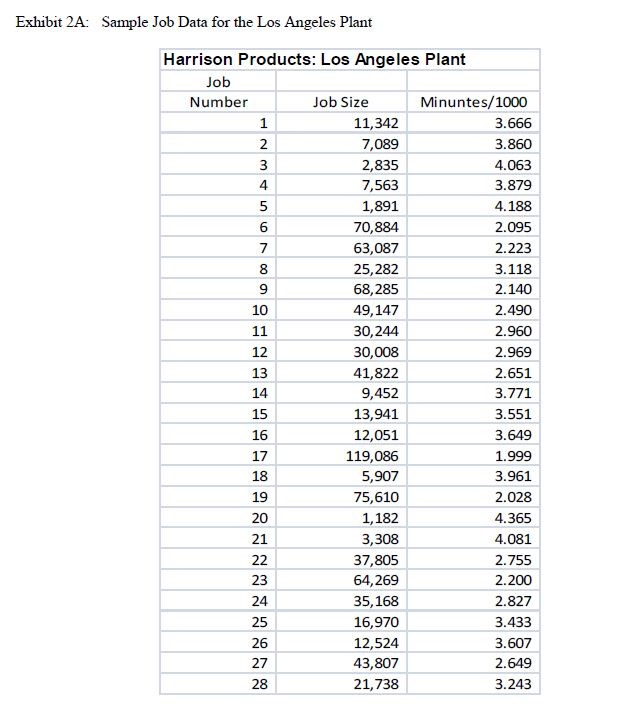
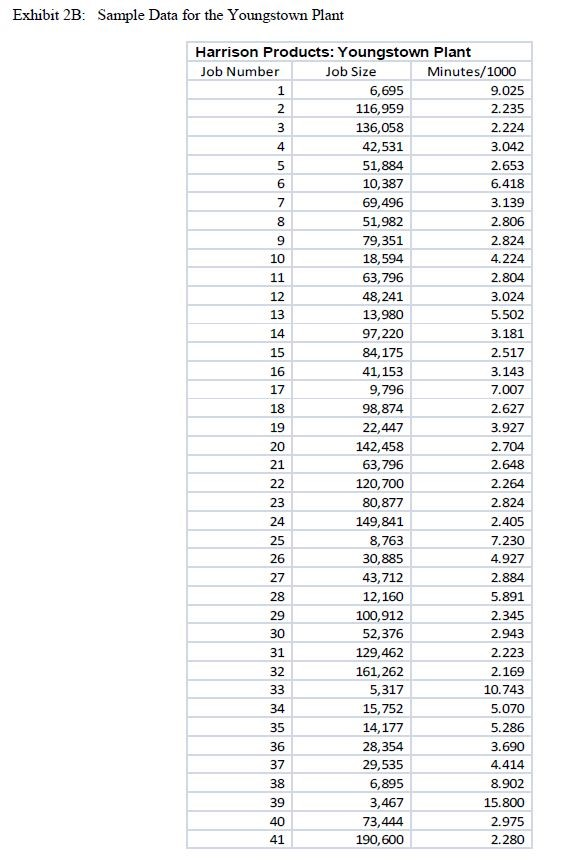
Harrison Products Inc. (HPI) is a global manufacturer of molded plastic products and metal products that are used in the auto industry, food and beverage industry (containers), and in a variety of other products and packaging materials. HPI has several manufacturing plant located world-wide, generally in locations convenient to the company's most significant customers. The present case considers one of HPI's products, a one gallon metal can container used for paint and other chemical products. The product is produced in two U.S. locations, Los Angeles, CA, and Youngstown, OH. These plants produce several milion of these cans each year. The competitive environment for HPI is challenging. Competitors in all parts of the world challenge HPI on cost which is the primary order-winning factor in the business. All HPI customers expect very high quality and prompt service, so competition on price and reliability in meeting delivery dates are critical to its competitive success Operating Data and Strategy HPI has focused its production of the one gallon metal cans in the two plants, in Los Angeles and Youngstown, Ohio. The summary information in Exhibit 1 shows the plant capacity, normal production, price and cost information. Currently, management believes that production costs are driven by volume; management's goal meet competitive cost pressures by increasing volume and improving efficiency to bring costs down. For this reason, product costs are based on volume, as illustrated in Exhibit 1. The unit cost for the Los Angeles plant is $1.10, while the unit cost in the Youngstown plant is $1.00. The cost difference reflects the higher facilities cost at the Los Angeles plant, which is the newer of the two plants. The Los Angeles plant has similar equipment and manufacturing flow design to that of the Youngstown plant, but a key difference is that the Los Angeles plant was designed to be more efficient for smaller job (batch) sizes; the equipment and plant lay-out are consistent with greater speed in processing smaller jobs. The decision to design the Los Angeles plant in this way reflected the smaller orders that were generally received by the Los Angeles plant. See Exhibit 2 for a sample of the some of the jobs at the two plants, the exhibit shows a representative sample of 28 jobs for Los Angles and 41 jobs at the Youngstown plant, showing the quantity in each job (job size) and the estimated minutes per 1,000 units for that job The number of minutes per 1,000 units is a commonly-used measure of job performance at HPI and is called "runtime Product Costs HPI includes manufacturing costs into three main categories. First, there is materials cost that includes the metal and other materials necessary in the production of the cans. These materials are considered direct materials and are S0.40 per unit at each of HFI's plants. The second category is operating costs which include labor, supervision, some materials used in machine maintenance and repair, materials receiving and stocking, and related costs. Labor osts include runtime labor, setup labor and downtime labor. Operations costs are considered indirect costs and the costing method used is to apply these costs to product based on units of output, as noted above. The two plants have the same per unit operating cost of $0.50 The third category, facilities costs, includes equipment and the plant facility. Because Los Angeles is the newer plant, these costs are higher for Los Angeles, at $0.20 per unit relative to the Youngstown plant, where the facilities cost is $0.10 per unit Required 1. Using the company's current costing system, calculate the manufacturing cost and operating margin (price less manufacturing cost) for each of the jobs in Exhibit 2, for both the Los Angeles and Youngstown plants. Assume that 20% of operating costs are due to setup costs and that the remainder are runtime costs. considering an activity-based approach which would apply setup costs to each job; each job would be applied the same amount of setup cost. Calculate the manufacturing cost and operating margin for each o the jobs in Exhibit 2, for both the Los Angeles and Youngstown plants. 2. HFI is 3. Assume as above that 20% of operating costs are due to setup costs and that the remainder are runtime costs. Now, assume that HFI is considering an activity-based approach which would recognize that each setup requires time and material that is partly proportional to the size of the prior job. That is, the part of setup that involves clean-up and preparation of the machine for a new job is longer after a relatively long job than it is for setups that follow a relatively short job. HFI now plans to apply setup costs so that one half of the setup costs would be applied equally to each job and the remainder of setup costs would be applied based on the number of units in the job. Calculate the manufacturing cost and operating margin for each of the jobs in Exhibit 2, for both the Los Angeles and Youngstown plants Interpret briefly your findings in parts 1,2 and 3 above. Do you support the setup cost application approach in (3) above? Why or why not? Using analysis based on charts, correlation or regression analysis or other means, study (a) the relationship between runtime and job size at both plants, and (b) examine how this relationship differs between the two plants. What are the implications of these relationships, and how they differ between plants, on (a) product costing, and (b) manufacturing strategy? 6 4. 0 What approach do you think would be preferable? 5. Exhibit 1 Current Operating Data for HPI Price Materials cost/unit Annual Overhead Budget 1.40 $ 0.40 1.40 0.40 Operations (Runtime and setup) Facilities Annual normal production units Annual number of jobs Plant Capacity (units/year), approx 30,000,000 12,000,000 60,000,000 2,000 100,000,000 50,000,000 10,000,000 100,000,000 1,500 125,000,000 Product Costs Materials Cost/unit Operations Cost/unit Facilities Cost/unit 0.400 0.500 0.200 1.100 0.300 0.400 0.500 0.100 1.000 0.400 Operating margin/unit $18,000,000 $ 40,000,000 32,000,000 8,000,000 Total operating margin General, Selling, and Adm. Costs Before-Tax income 16,000,000 2,000,000 Exhibit 2A Sample Job Data for the Los Angeles Plant Harrison Products: Los Angeles Plant Job Number Job Size Minuntes/1000 3.666 3.860 4.063 3.879 4.188 2.095 2.223 3.118 2.140 2.490 2.960 2.969 2.651 11,342 7,089 2,835 7,563 1,891 70,884 63,087 25,282 68,285 49,147 30,244 30,008 41,822 9,452 13,941 12,051 119,086 5,907 75,610 1,182 3,308 37,805 64,269 35,168 16,970 12,524 43,807 21,738 8 10 12 13 14 15 16 17 18 19 20 21 3.551 3.649 1.999 3.961 2.028 4.365 4.081 2.755 2.200 2.827 3.433 3.607 2.649 3.243 23 24 25 26 27 28 Exhibit 2B: Sample Data for the Youngstown Plant Harrison Products: Youngstown Plant ob Number Job Size Minutes/1000 6,695 116,959 136,058 42,531 51,884 10,387 69,496 51,982 79,351 18,594 63,796 48,241 13,980 97,220 84,175 41,153 9,796 98,874 22,447 142,458 63,796 120,700 80,877 149,841 8,763 30,885 43,712 12,160 100,912 52,376 129,462 161,262 5,317 15,752 14,177 28,354 29,535 6,895 3,467 73,444 190,600 9.025 2.235 2.224 3.042 2.653 6.418 3.139 2.806 2.824 4.224 2.804 3.024 5.502 3.181 2.517 3.143 7.007 2.627 3.927 2.704 2.648 2.264 2.824 2.405 7.230 4.927 2.884 5.891 2.345 2.943 2.223 2.169 10.743 5.070 5.286 3.690 4.414 8.902 15.800 2.975 2.280 9 10 13 14 15 16 17 18 21 23 26 28 29 31 32 34 35 36 37 38 41
Step by Step Solution
There are 3 Steps involved in it
Step: 1

Get Instant Access to Expert-Tailored Solutions
See step-by-step solutions with expert insights and AI powered tools for academic success
Step: 2

Step: 3
Ace Your Homework with AI
Get the answers you need in no time with our AI-driven, step-by-step assistance
Get Started
New Markets Tax Credit IRS Audit Technique Guide
Authors: Internal Revenue Service
1st Edition
1304112896, 978-1304112897