

Answered step by step
Verified Expert Solution
Question
1 Approved Answer
Brock's administration is thinking about implementing a policy of coed floors only in dormitories. Currently there are only single gender floors. One reason behind
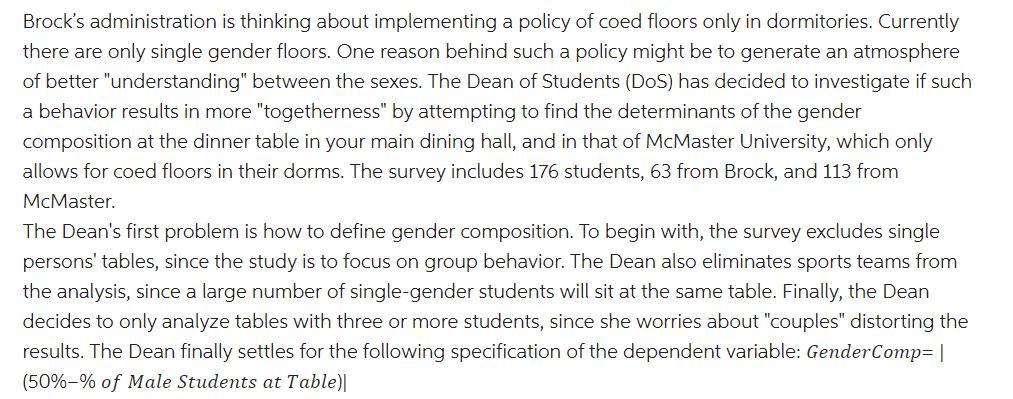
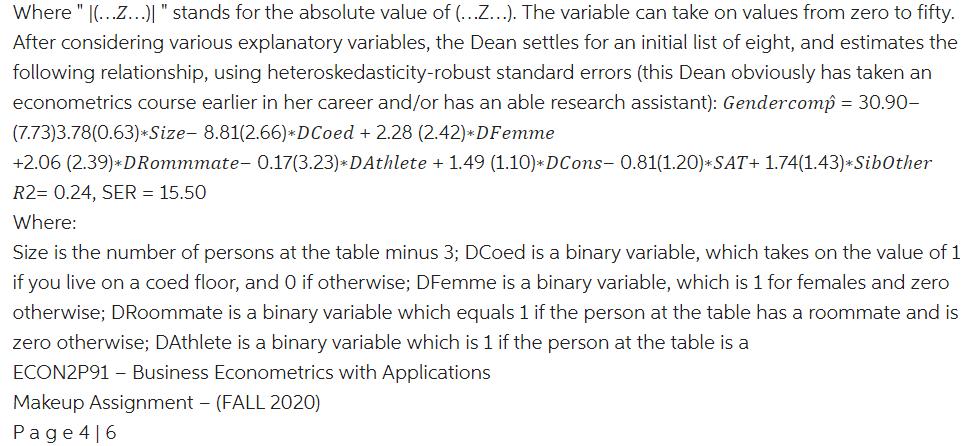
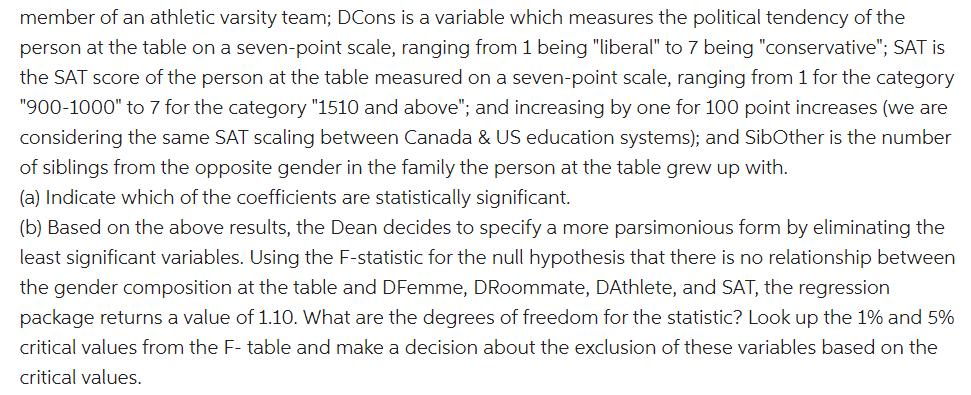
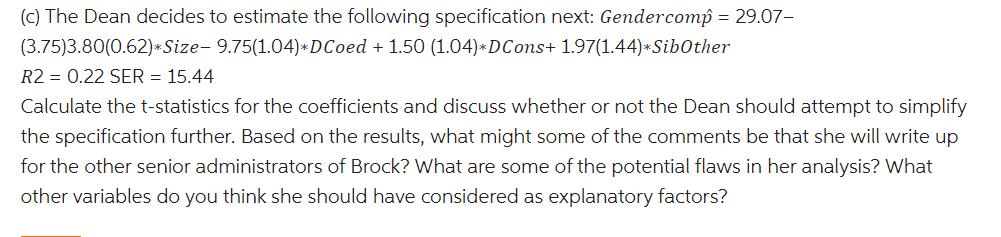
Brock's administration is thinking about implementing a policy of coed floors only in dormitories. Currently there are only single gender floors. One reason behind such a policy might be to generate an atmosphere of better "understanding" between the sexes. The Dean of Students (DoS) has decided to investigate if such a behavior results in more "togetherness" by attempting to find the determinants of the gender composition at the dinner table in your main dining hall, and in that of McMaster University, which only allows for coed floors in their dorms. The survey includes 176 students, 63 from Brock, and 113 from McMaster. The Dean's first problem is how to define gender composition. To begin with, the survey excludes single persons' tables, since the study is to focus on group behavior. The Dean also eliminates sports teams from the analysis, since a large number of single-gender students will sit at the same table. Finally, the Dean decides to only analyze tables with three or more students, since she worries about "couples" distorting the results. The Dean finally settles for the following specification of the dependent variable: GenderComp= | (50%-% of Male Students at Table)| Where " |(...z...)| " stands for the absolute value of (...Z...). The variable can take on values from zero to fifty. After considering various explanatory variables, the Dean settles for an initial list of eight, and estimates the following relationship, using heteroskedasticity-robust standard errors (this Dean obviously has taken an econometrics course earlier in her career and/or has an able research assistant): Gendercomp = 30.90- (7.73)3.78(0.63)*Size- 8.81(2.66)*DCoed + 2.28 (2.42)*DFemme +2.06 (2.39)*DRommmate- 0.17(3.23)*DAthlete + 1.49 (1.10)* DCons- 0.81(1.20)*SAT+ 1.74(1.43)*SibOther R2= 0.24, SER = 15.50 Where: Size is the number of persons at the table minus 3; DCoed is a binary variable, which takes on the value of 1 if you live on a coed floor, and 0 if otherwise; DFemme is a binary variable, which is 1 for females and zero otherwise; DRoommate is a binary variable which equals 1 if the person at the table has a roommate and is zero otherwise; DAthlete is a binary variable which is 1 if the person at the table is a ECON2P91 - Business Econometrics with Applications Makeup Assignment - (FALL 2020) Page 4|6 member of an athletic varsity team; DCons is a variable which measures the political tendency of the person at the table on a seven-point scale, ranging from 1 being "liberal" to 7 being "conservative"; SAT is the SAT score of the person at the table measured on a seven-point scale, ranging from 1 for the category "900-1000" to 7 for the category "1510 and above"; and increasing by one for 100 point increases (we are considering the same SAT scaling between Canada & US education systems); and SibOther is the number of siblings from the opposite gender in the family the person at the table grew up with. (a) Indicate which of the coefficients are statistically significant. (b) Based on the above results, the Dean decides to specify a more parsimonious form by eliminating the least significant variables. Using the F-statistic for the null hypothesis that there is no relationship between the gender composition at the table and DFemme, DRoommate, DAthlete, and SAT, the regression package returns a value of 1.10. What are the degrees of freedom for the statistic? Look up the 1% and 5% critical values from the F- table and make a decision about the exclusion of these variables based on the critical values. (c) The Dean decides to estimate the following specification next: Gendercomp = 29.07- (3.75)3.80(0.62)*Size- 9.75(1.04)*DCoed + 1.50 (1.04)*DCons+ 1.97(1.44)*SibOther R2 = 0.22 SER = 15.44 Calculate the t-statistics for the coefficients and discuss whether or not the Dean should attempt to simplify the specification further. Based on the results, what might some of the comments be that she will write up for the other senior administrators of Brock? What are some of the potential flaws in her analysis? What other variables do you think she should have considered as explanatory factors? Brock's administration is thinking about implementing a policy of coed floors only in dormitories. Currently there are only single gender floors. One reason behind such a policy might be to generate an atmosphere of better "understanding" between the sexes. The Dean of Students (DoS) has decided to investigate if such a behavior results in more "togetherness" by attempting to find the determinants of the gender composition at the dinner table in your main dining hall, and in that of McMaster University, which only allows for coed floors in their dorms. The survey includes 176 students, 63 from Brock, and 113 from McMaster. The Dean's first problem is how to define gender composition. To begin with, the survey excludes single persons' tables, since the study is to focus on group behavior. The Dean also eliminates sports teams from the analysis, since a large number of single-gender students will sit at the same table. Finally, the Dean decides to only analyze tables with three or more students, since she worries about "couples" distorting the results. The Dean finally settles for the following specification of the dependent variable: GenderComp= | (50%-% of Male Students at Table)| Where " |(...z...)| " stands for the absolute value of (...Z...). The variable can take on values from zero to fifty. After considering various explanatory variables, the Dean settles for an initial list of eight, and estimates the following relationship, using heteroskedasticity-robust standard errors (this Dean obviously has taken an econometrics course earlier in her career and/or has an able research assistant): Gendercomp = 30.90- (7.73)3.78(0.63)*Size- 8.81(2.66)*DCoed + 2.28 (2.42)*DFemme +2.06 (2.39)*DRommmate- 0.17(3.23)*DAthlete + 1.49 (1.10)* DCons- 0.81(1.20)*SAT+ 1.74(1.43)*SibOther R2= 0.24, SER = 15.50 Where: Size is the number of persons at the table minus 3; DCoed is a binary variable, which takes on the value of 1 if you live on a coed floor, and 0 if otherwise; DFemme is a binary variable, which is 1 for females and zero otherwise; DRoommate is a binary variable which equals 1 if the person at the table has a roommate and is zero otherwise; DAthlete is a binary variable which is 1 if the person at the table is a ECON2P91 - Business Econometrics with Applications Makeup Assignment - (FALL 2020) Page 4|6 member of an athletic varsity team; DCons is a variable which measures the political tendency of the person at the table on a seven-point scale, ranging from 1 being "liberal" to 7 being "conservative"; SAT is the SAT score of the person at the table measured on a seven-point scale, ranging from 1 for the category "900-1000" to 7 for the category "1510 and above"; and increasing by one for 100 point increases (we are considering the same SAT scaling between Canada & US education systems); and SibOther is the number of siblings from the opposite gender in the family the person at the table grew up with. (a) Indicate which of the coefficients are statistically significant. (b) Based on the above results, the Dean decides to specify a more parsimonious form by eliminating the least significant variables. Using the F-statistic for the null hypothesis that there is no relationship between the gender composition at the table and DFemme, DRoommate, DAthlete, and SAT, the regression package returns a value of 1.10. What are the degrees of freedom for the statistic? Look up the 1% and 5% critical values from the F- table and make a decision about the exclusion of these variables based on the critical values. (c) The Dean decides to estimate the following specification next: Gendercomp = 29.07- (3.75)3.80(0.62)*Size- 9.75(1.04)*DCoed + 1.50 (1.04)*DCons+ 1.97(1.44)*SibOther R2 = 0.22 SER = 15.44 Calculate the t-statistics for the coefficients and discuss whether or not the Dean should attempt to simplify the specification further. Based on the results, what might some of the comments be that she will write up for the other senior administrators of Brock? What are some of the potential flaws in her analysis? What other variables do you think she should have considered as explanatory factors? Brock's administration is thinking about implementing a policy of coed floors only in dormitories. Currently there are only single gender floors. One reason behind such a policy might be to generate an atmosphere of better "understanding" between the sexes. The Dean of Students (DoS) has decided to investigate if such a behavior results in more "togetherness" by attempting to find the determinants of the gender composition at the dinner table in your main dining hall, and in that of McMaster University, which only allows for coed floors in their dorms. The survey includes 176 students, 63 from Brock, and 113 from McMaster. The Dean's first problem is how to define gender composition. To begin with, the survey excludes single persons' tables, since the study is to focus on group behavior. The Dean also eliminates sports teams from the analysis, since a large number of single-gender students will sit at the same table. Finally, the Dean decides to only analyze tables with three or more students, since she worries about "couples" distorting the results. The Dean finally settles for the following specification of the dependent variable: GenderComp= | (50%-% of Male Students at Table)| Where " |(...z...)| " stands for the absolute value of (...Z...). The variable can take on values from zero to fifty. After considering various explanatory variables, the Dean settles for an initial list of eight, and estimates the following relationship, using heteroskedasticity-robust standard errors (this Dean obviously has taken an econometrics course earlier in her career and/or has an able research assistant): Gendercomp = 30.90- (7.73)3.78(0.63)*Size- 8.81(2.66)*DCoed + 2.28 (2.42)*DFemme +2.06 (2.39)*DRommmate- 0.17(3.23)*DAthlete + 1.49 (1.10)* DCons- 0.81(1.20)*SAT+ 1.74(1.43)*SibOther R2= 0.24, SER = 15.50 Where: Size is the number of persons at the table minus 3; DCoed is a binary variable, which takes on the value of 1 if you live on a coed floor, and 0 if otherwise; DFemme is a binary variable, which is 1 for females and zero otherwise; DRoommate is a binary variable which equals 1 if the person at the table has a roommate and is zero otherwise; DAthlete is a binary variable which is 1 if the person at the table is a ECON2P91 - Business Econometrics with Applications Makeup Assignment - (FALL 2020) Page 4|6 member of an athletic varsity team; DCons is a variable which measures the political tendency of the person at the table on a seven-point scale, ranging from 1 being "liberal" to 7 being "conservative"; SAT is the SAT score of the person at the table measured on a seven-point scale, ranging from 1 for the category "900-1000" to 7 for the category "1510 and above"; and increasing by one for 100 point increases (we are considering the same SAT scaling between Canada & US education systems); and SibOther is the number of siblings from the opposite gender in the family the person at the table grew up with. (a) Indicate which of the coefficients are statistically significant. (b) Based on the above results, the Dean decides to specify a more parsimonious form by eliminating the least significant variables. Using the F-statistic for the null hypothesis that there is no relationship between the gender composition at the table and DFemme, DRoommate, DAthlete, and SAT, the regression package returns a value of 1.10. What are the degrees of freedom for the statistic? Look up the 1% and 5% critical values from the F- table and make a decision about the exclusion of these variables based on the critical values. (c) The Dean decides to estimate the following specification next: Gendercomp = 29.07- (3.75)3.80(0.62)*Size- 9.75(1.04)*DCoed + 1.50 (1.04)*DCons+ 1.97(1.44)*SibOther R2 = 0.22 SER = 15.44 Calculate the t-statistics for the coefficients and discuss whether or not the Dean should attempt to simplify the specification further. Based on the results, what might some of the comments be that she will write up for the other senior administrators of Brock? What are some of the potential flaws in her analysis? What other variables do you think she should have considered as explanatory factors? Brock's administration is thinking about implementing a policy of coed floors only in dormitories. Currently there are only single gender floors. One reason behind such a policy might be to generate an atmosphere of better "understanding" between the sexes. The Dean of Students (DoS) has decided to investigate if such a behavior results in more "togetherness" by attempting to find the determinants of the gender composition at the dinner table in your main dining hall, and in that of McMaster University, which only allows for coed floors in their dorms. The survey includes 176 students, 63 from Brock, and 113 from McMaster. The Dean's first problem is how to define gender composition. To begin with, the survey excludes single persons' tables, since the study is to focus on group behavior. The Dean also eliminates sports teams from the analysis, since a large number of single-gender students will sit at the same table. Finally, the Dean decides to only analyze tables with three or more students, since she worries about "couples" distorting the results. The Dean finally settles for the following specification of the dependent variable: GenderComp= | (50%-% of Male Students at Table)| Where " |(...z...)| " stands for the absolute value of (...Z...). The variable can take on values from zero to fifty. After considering various explanatory variables, the Dean settles for an initial list of eight, and estimates the following relationship, using heteroskedasticity-robust standard errors (this Dean obviously has taken an econometrics course earlier in her career and/or has an able research assistant): Gendercomp = 30.90- (7.73)3.78(0.63)*Size- 8.81(2.66)*DCoed + 2.28 (2.42)*DFemme +2.06 (2.39)*DRommmate- 0.17(3.23)*DAthlete + 1.49 (1.10)* DCons- 0.81(1.20)*SAT+ 1.74(1.43)*SibOther R2= 0.24, SER = 15.50 Where: Size is the number of persons at the table minus 3; DCoed is a binary variable, which takes on the value of 1 if you live on a coed floor, and 0 if otherwise; DFemme is a binary variable, which is 1 for females and zero otherwise; DRoommate is a binary variable which equals 1 if the person at the table has a roommate and is zero otherwise; DAthlete is a binary variable which is 1 if the person at the table is a ECON2P91 - Business Econometrics with Applications Makeup Assignment - (FALL 2020) Page 4|6 member of an athletic varsity team; DCons is a variable which measures the political tendency of the person at the table on a seven-point scale, ranging from 1 being "liberal" to 7 being "conservative"; SAT is the SAT score of the person at the table measured on a seven-point scale, ranging from 1 for the category "900-1000" to 7 for the category "1510 and above"; and increasing by one for 100 point increases (we are considering the same SAT scaling between Canada & US education systems); and SibOther is the number of siblings from the opposite gender in the family the person at the table grew up with. (a) Indicate which of the coefficients are statistically significant. (b) Based on the above results, the Dean decides to specify a more parsimonious form by eliminating the least significant variables. Using the F-statistic for the null hypothesis that there is no relationship between the gender composition at the table and DFemme, DRoommate, DAthlete, and SAT, the regression package returns a value of 1.10. What are the degrees of freedom for the statistic? Look up the 1% and 5% critical values from the F- table and make a decision about the exclusion of these variables based on the critical values. (c) The Dean decides to estimate the following specification next: Gendercomp = 29.07- (3.75)3.80(0.62)*Size- 9.75(1.04)*DCoed + 1.50 (1.04)*DCons+ 1.97(1.44)*SibOther R2 = 0.22 SER = 15.44 Calculate the t-statistics for the coefficients and discuss whether or not the Dean should attempt to simplify the specification further. Based on the results, what might some of the comments be that she will write up for the other senior administrators of Brock? What are some of the potential flaws in her analysis? What other variables do you think she should have considered as explanatory factors? Brock's administration is thinking about implementing a policy of coed floors only in dormitories. Currently there are only single gender floors. One reason behind such a policy might be to generate an atmosphere of better "understanding" between the sexes. The Dean of Students (DoS) has decided to investigate if such a behavior results in more "togetherness" by attempting to find the determinants of the gender composition at the dinner table in your main dining hall, and in that of McMaster University, which only allows for coed floors in their dorms. The survey includes 176 students, 63 from Brock, and 113 from McMaster. The Dean's first problem is how to define gender composition. To begin with, the survey excludes single persons' tables, since the study is to focus on group behavior. The Dean also eliminates sports teams from the analysis, since a large number of single-gender students will sit at the same table. Finally, the Dean decides to only analyze tables with three or more students, since she worries about "couples" distorting the results. The Dean finally settles for the following specification of the dependent variable: GenderComp= | (50%-% of Male Students at Table)| Where " |(...z...)| " stands for the absolute value of (...Z...). The variable can take on values from zero to fifty. After considering various explanatory variables, the Dean settles for an initial list of eight, and estimates the following relationship, using heteroskedasticity-robust standard errors (this Dean obviously has taken an econometrics course earlier in her career and/or has an able research assistant): Gendercomp = 30.90- (7.73)3.78(0.63)*Size- 8.81(2.66)*DCoed + 2.28 (2.42)*DFemme +2.06 (2.39)*DRommmate- 0.17(3.23)*DAthlete + 1.49 (1.10)* DCons- 0.81(1.20)*SAT+ 1.74(1.43)*SibOther R2= 0.24, SER = 15.50 Where: Size is the number of persons at the table minus 3; DCoed is a binary variable, which takes on the value of 1 if you live on a coed floor, and 0 if otherwise; DFemme is a binary variable, which is 1 for females and zero otherwise; DRoommate is a binary variable which equals 1 if the person at the table has a roommate and is zero otherwise; DAthlete is a binary variable which is 1 if the person at the table is a ECON2P91 - Business Econometrics with Applications Makeup Assignment - (FALL 2020) Page 4|6 member of an athletic varsity team; DCons is a variable which measures the political tendency of the person at the table on a seven-point scale, ranging from 1 being "liberal" to 7 being "conservative"; SAT is the SAT score of the person at the table measured on a seven-point scale, ranging from 1 for the category "900-1000" to 7 for the category "1510 and above"; and increasing by one for 100 point increases (we are considering the same SAT scaling between Canada & US education systems); and SibOther is the number of siblings from the opposite gender in the family the person at the table grew up with. (a) Indicate which of the coefficients are statistically significant. (b) Based on the above results, the Dean decides to specify a more parsimonious form by eliminating the least significant variables. Using the F-statistic for the null hypothesis that there is no relationship between the gender composition at the table and DFemme, DRoommate, DAthlete, and SAT, the regression package returns a value of 1.10. What are the degrees of freedom for the statistic? Look up the 1% and 5% critical values from the F- table and make a decision about the exclusion of these variables based on the critical values. (c) The Dean decides to estimate the following specification next: Gendercomp = 29.07- (3.75)3.80(0.62)*Size- 9.75(1.04)*DCoed + 1.50 (1.04)*DCons+ 1.97(1.44)*SibOther R2 = 0.22 SER = 15.44 Calculate the t-statistics for the coefficients and discuss whether or not the Dean should attempt to simplify the specification further. Based on the results, what might some of the comments be that she will write up for the other senior administrators of Brock? What are some of the potential flaws in her analysis? What other variables do you think she should have considered as explanatory factors?
Step by Step Solution
★★★★★
3.45 Rating (142 Votes )
There are 3 Steps involved in it
Step: 1
The administration of your universitycollege is thinking about implementing a policy of coed floors ...
Get Instant Access to Expert-Tailored Solutions
See step-by-step solutions with expert insights and AI powered tools for academic success
Step: 2

Step: 3
Ace Your Homework with AI
Get the answers you need in no time with our AI-driven, step-by-step assistance
Get Started
A Pathway To Introductory Statistics
Authors: Jay Lehmann
1st Edition
0134107179, 978-0134107172