Answered step by step
Verified Expert Solution
Question
1 Approved Answer
he manager of a 1 5 0 0 - bed healthcare organization is concerned about the rate of healthcare - associated infections ( HAIs )
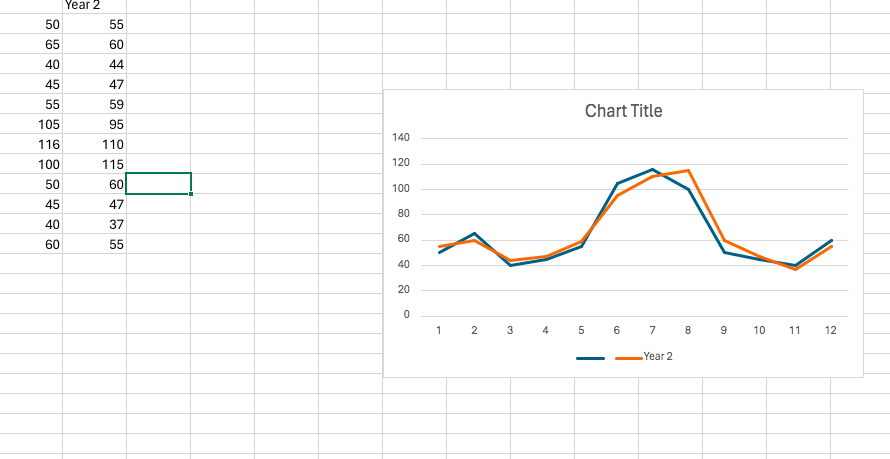
he manager of a bed healthcare organization is concerned about the rate of healthcareassociated infections HAIs recorded in the facilities under her responsibility. She collects monthly data for HAIs rates across all the facilities for months. Plot one Run Chart Line Graph of the provided year data set using Microsoft Excel. Hint: There should be just one continuous line chart for both years, starting with year
How many Runs are present in the Run Chart? Did you detect any special cause variation? If so briefly explain how these were detected.
The national average rate for HAI is about in hospital patients. How do the provided data compare with the national average? Give some possible explanations for the observed data and provide recommendations for addressing the problem.
What are Type I and Type II errors in Control Chart analysis? Provide an example of each.
Year : Monthly Rates of HAIs per patients
J F M A M J J A S O N D
Year : Monthly Rates of HAIs per patients
J F M A M J J A S O N D

Step by Step Solution
There are 3 Steps involved in it
Step: 1

Get Instant Access to Expert-Tailored Solutions
See step-by-step solutions with expert insights and AI powered tools for academic success
Step: 2

Step: 3

Ace Your Homework with AI
Get the answers you need in no time with our AI-driven, step-by-step assistance
Get Started


