

Question
Heat map is a graphical representation of data where the individual values contained in a matrix are represented as colors. These colors represent the level
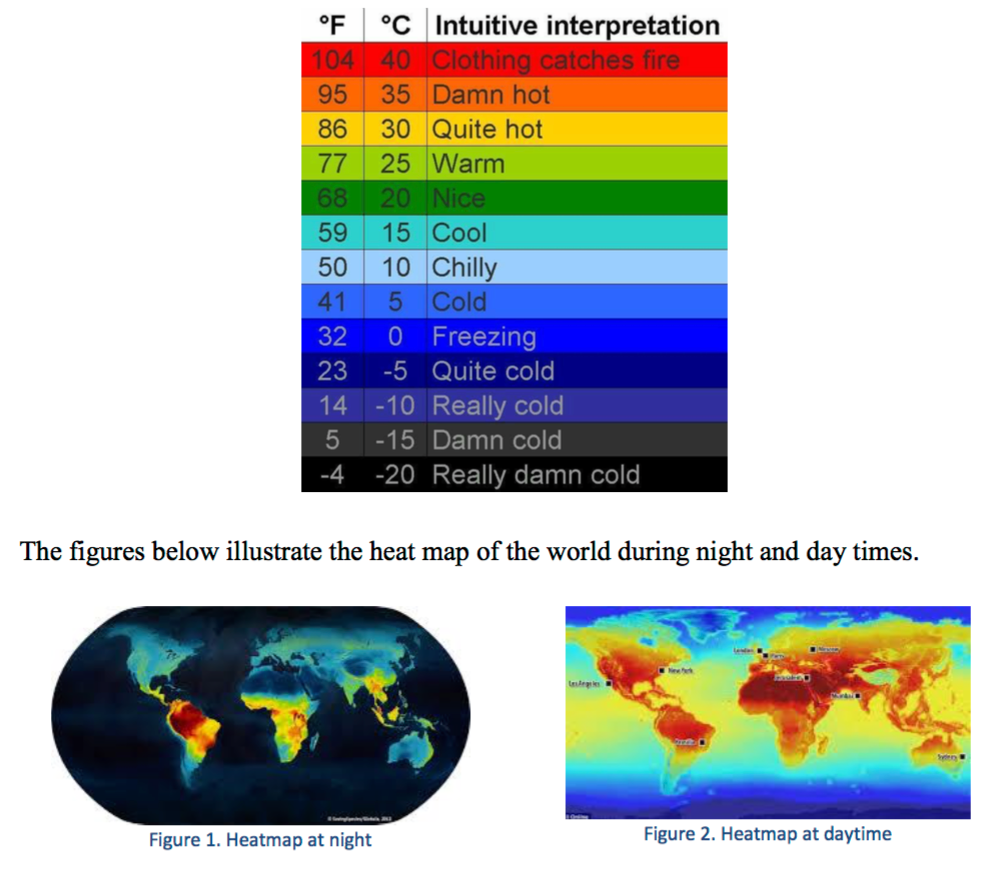
Heat map is a graphical representation of data where the individual values contained in a matrix are represented as colors. These colors represent the level of the temperature at certain location. The red color represents the highest temperature, whereas, the black color represents the lowest temperature. The table below illustrates each color with its associated temperature in both Fahrenheit and Celsius.
Things to be considered:
1-Consider having ?? ?? points where ?? and ?? can be very large (? 1M).
2-Randomly, select 25% of the points to be the source of heat (have the highest level of the temperature).
3-The heat is spread among the neighboring points with range of 8%. 4-The points which are neighboring to high temperature points get 70% of their temperature. 5-At night, the temperature of each heat source is reduced by 40%. This affects the temperature of the neighboring points accordingly.
**Write a program in "Java , C OR C++" that does the above computations. Your output shall be as follows:
1) Location and number of the points which their average temperature is
a-Between 30 C to 40 C
b-Between 20 C to 30 C
c-Between 10 C to 20 C
d-Between 0 C to 10 C
e-Between -10 C to 0 C
f-Between -20 C to -10 C
2) Average of the whole points.
3) Compute (1) and (2) for night time and day time.
4) Print an output of the scaled down of ?? ?? points such that it fits the screen.
Before writing the program, choose an appropriate data structure for the data representation.
**Answer the followings after writing the program:
1) Which data structure did you use? Why?
2) What technique did you use for the computations?
3) What technique did you use for the data storage?
4) What technique did you use to scale down the ?? ?? points?
5) What is the time and space complexity of your program?
After that,
**Convert the above Heatmap into 3D Heatmap to include the temperature of the heart of the earth till its surface. You need to do some investigations about the temperature values.
OFCIntuitive interpretation 104 40 Clothing catches fire 95 35 Damn hot 86 30 Quite hot 77 25 Warm 68 20 Nice 59 15 Cool 50 10 Chilly 41 5 Cold 32 0 Freezing 23 -5 Quite cold 14 10 Really cold 5 -15 Damn cold 4 -20 Really damn cold The figures below illustrate the heat map of the world during night and day times. Figure 1. Heatmap at night Figure 2. Heatmap at daytime OFCIntuitive interpretation 104 40 Clothing catches fire 95 35 Damn hot 86 30 Quite hot 77 25 Warm 68 20 Nice 59 15 Cool 50 10 Chilly 41 5 Cold 32 0 Freezing 23 -5 Quite cold 14 10 Really cold 5 -15 Damn cold 4 -20 Really damn cold The figures below illustrate the heat map of the world during night and day times. Figure 1. Heatmap at night Figure 2. Heatmap at daytimeStep by Step Solution
There are 3 Steps involved in it
Step: 1

Get Instant Access to Expert-Tailored Solutions
See step-by-step solutions with expert insights and AI powered tools for academic success
Step: 2

Step: 3
Ace Your Homework with AI
Get the answers you need in no time with our AI-driven, step-by-step assistance
Get Started
Database And Expert Systems Applications Dexa 2021 Workshops Biokdd Iwcfs Mlkgraphs Al Cares Protime Alsys 2021 Virtual Event September 27 30 2021 Proceedings
Authors: Gabriele Kotsis ,A Min Tjoa ,Ismail Khalil ,Bernhard Moser ,Atif Mashkoor ,Johannes Sametinger ,Anna Fensel ,Jorge Martinez-Gil ,Lukas Fischer
1st Edition
3030871002, 978-3030871000