Heat treating is often used to carburize metal parts, such as gears. The thickness of the carburized layer is
considered a crucial feature of the gear and contributes to the overall reliability of the part. Because of the
critical nature of this feature, two different lab tests are performed on each furnace load. One test is run on
a sample pin that accompanies each load. The other test is a destructive test, where an actual part is cross-
sectioned. This test involves running a carbon analysis on the surface of both the gear pitch (top of the gear
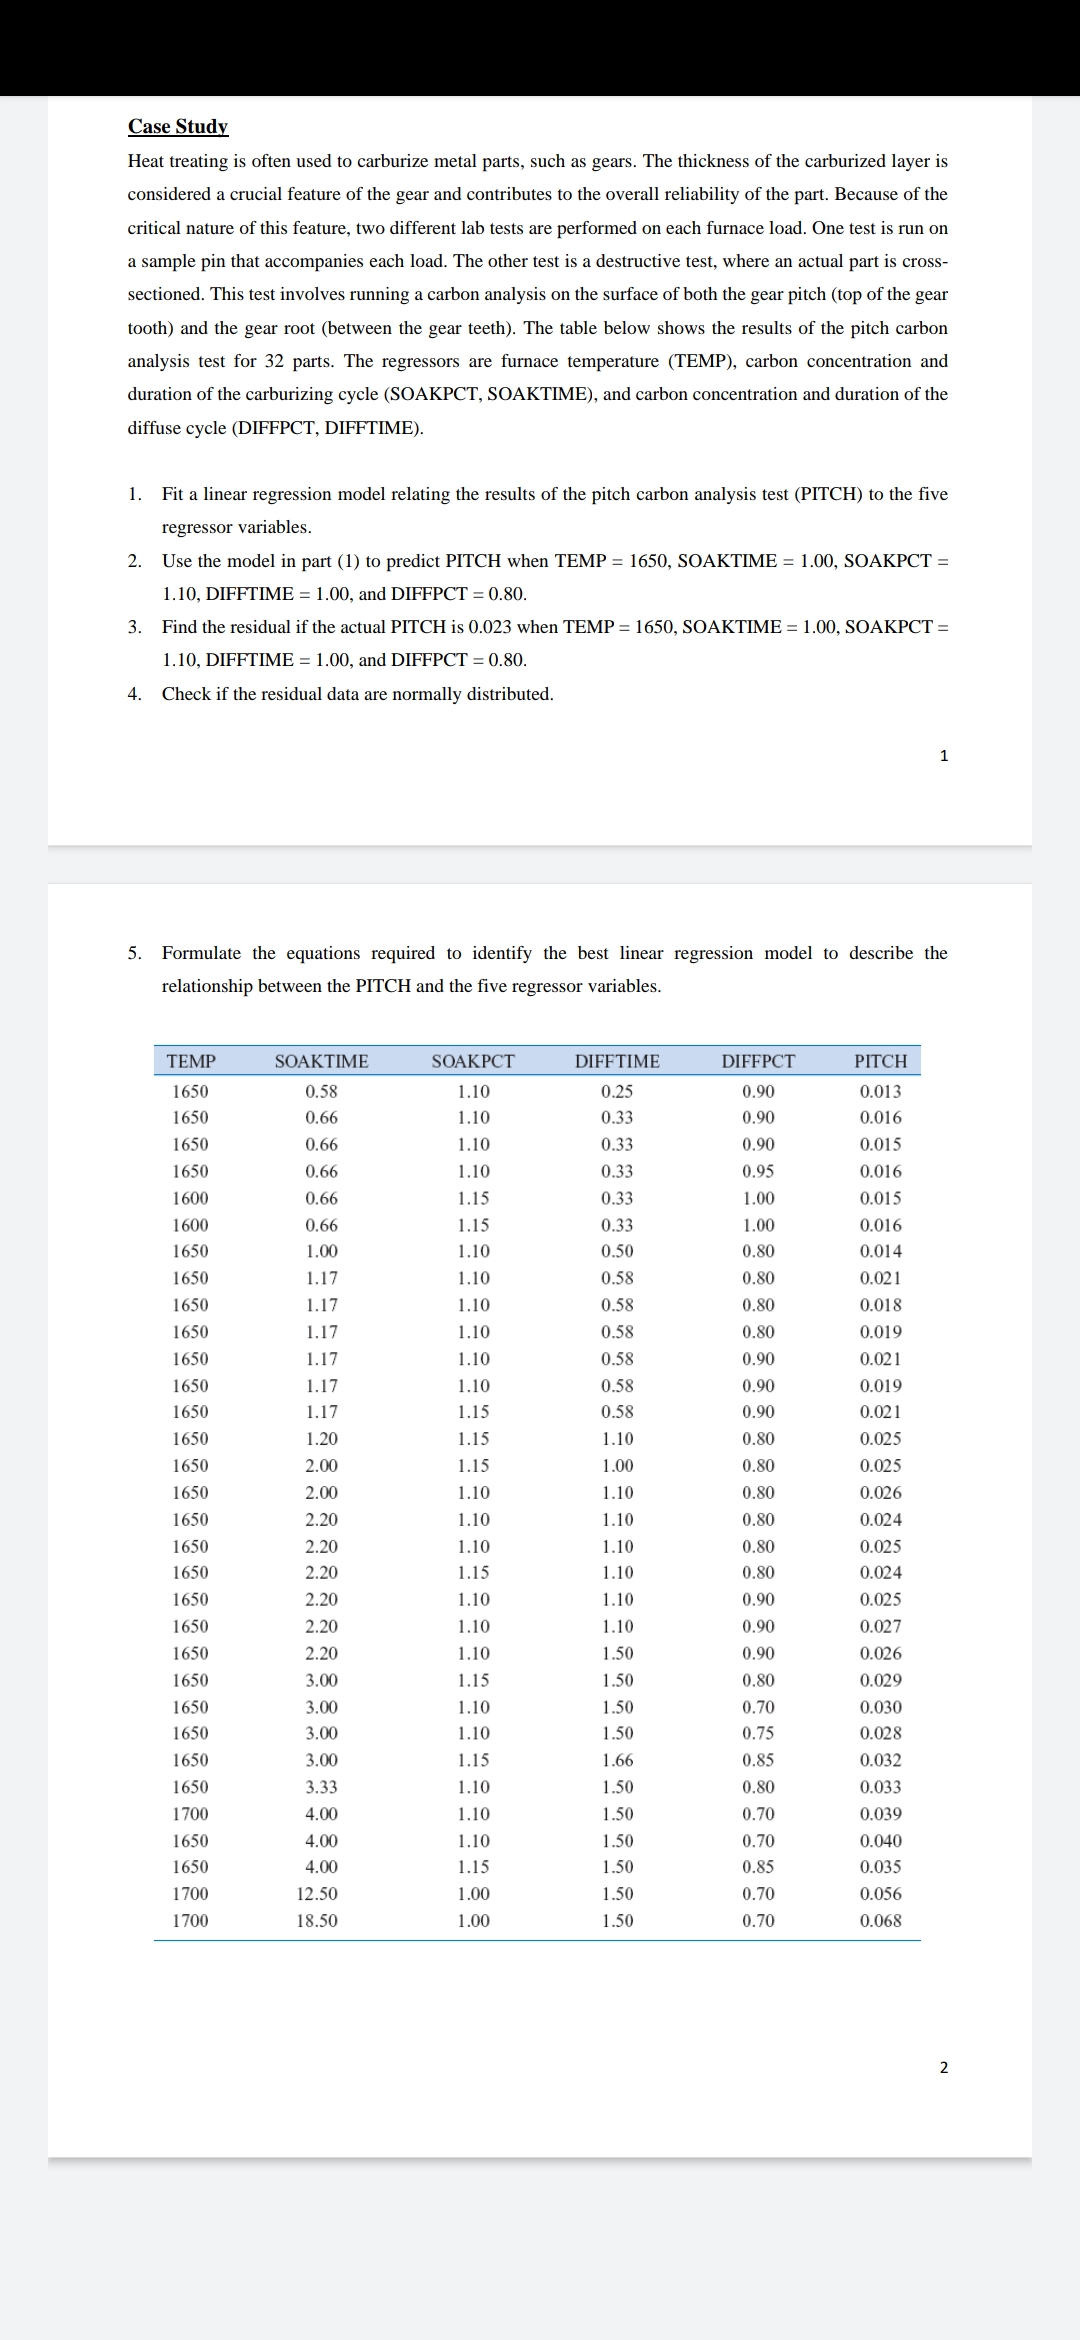
tooth) and the gear root (between the gear teeth). The table below shows the results of the pitch carbon
analysis test for 32 parts. The regressors are furnace temperature (TEMP), carbon concentration and
duration of the carburizing cycle (SOAKPCT, SOAKTIME), and carbon concentration and duration of the
diffuse cycle (DIFFPCT, DIFFTIME).
1. Fit a linear regression model relating the results of the pitch carbon analysis test (PITCH) to the five
regressor variables.
2. Use the model in part (1) to predict PITCH when TEMP = 1650, SOAKTIME = 1.00, SOAKPCT =
1.10, DIFFTIME = 1.00, and DIFFPCT = 0.80.
3. Find the residual if the actual PITCH is 0.023 when TEMP = 1650, SOAKTIME = 1.00, SOAKPCT =
1.10, DIFFTIME = 1.00, and DIFFPCT = 0.80.
4. Check if the residual data are normally distributed.
5. Formulate the equations required to identify the best linear regression model to describe
Case Studx Heat treating is often used to carburize metal pans, such as gears. The thickness of the carburized layer is considered a crucial feature of the gear and contributes to the overall reliability of the part. Because of the critical nature of this feature, two different lab tests are performed on each furnace load. One test is run on a sample pin that accompanies each load. The other test is a destructive test, where an actual part is cross- secticned. This test involves running a carbon analysis on the surface of both the gear pitch (top of the gear tooth) and the gear root (between the gear teeth). The table below shows the results of the pitch carbon analysis test for 32. parts. The regressors are furnace temperature (TEMP), carbon concentration and duration of the carburizing cycle (SOAKPCT, SOAKTIME), and carbon concentration and duration of the diffuse cycle (DlFFPCT, DIFFI'ME). 1. Fit a linear regression model relating the results of the pitch carbon analysis test (PITCH) to the ve regressor variables. 2. Use the model in pan (1) to predict PITCH when TEMP : 1650, SOAKTIME : 1.00, SOAKPCT : 1.10, DIFFI'IME =1.00, and DIFFPCT = 0.80. 3. Find the residual if the actual PITCH is 0.023 when TEMP : 1650, SOAKTIME = 1.00, SOAKPCI' = 1.10, DIFFTEME =1.00, and DIFFPCT : 0.80. 4. Check if the residual data are normally distributed. 5. Formulate the equations required to identify the best linear regression model to describe the relationship between the PITCH and the ve regressor variables. TEMP SDAKTIME SOAKPCI' DIFFI'IM'E DI'FFPCT PITCH I650 0.58 1.10 0.25 0.90 0.013 1650 0.66 1.10 0.33 0.90 0.016 1650 0.66 1.10 0.33 0.90 0.015 1650 0.66 1.10 0.33 0.95 01016 1600 0.66 1.15 0.33 1.00 0.015 1600 0.66 1.15 0.33 1.00 0.016 1650 1.00 1.10 0.50 0.80 0.014 1650 1.17 1.10 0.58 0.80 0.021 I650 1.17 I.10 0.58 0.80 0.018 1650 1.17 1.10 0.58 0.80 0.019 1650 1.17 1.10 0.58 0.90 0.021 1650 1.17 1.10 0.58 0.90 0.019 1650 1.17 1.15 0.58 0.90 0.021 1650 1.20 1.15 1.10 0.80 0.025 1650 2.00 1.15 1.00 0.80 0.025 1650 2.11) 1.10 1.10 0.80 0.026 1650 2.20 1.10 1.10 0.80 0.024 1650 2.20 1.10 1.10 0.80 0.025 1650 2.20 1.15 1.10 0.80 01024 1650 2.20 1.10 1.10 0.90 0.025 1650 2.20 1.10 1.10 0.90 0.027 1650 2.20 1.10 1.50 0.90 01026 1650 3.00 1.15 1.50 0.80 0.029 1650 3.00 1.10 1.50 0.70 0.030 1650 3.00 1.10 1.50 0.75 0.028 1650 3.00 1.15 1.66 0.85 0.032 1650 3.33 I.IO 1.50 0.80 0.033 1700 4.00 1.10 1.50 0.70 0.039 1650 4.00 1.10 1.50 0.70 0.040 1650 4.00 1.15 1.50 0.85 0.035 1700 12.50 1.00 1.50 0.70 0.056 1700 18.50 1.00 1.50 0.70 0.068