

Answered step by step
Verified Expert Solution
Question
1 Approved Answer
Heatmap From the data table for Orders, create a pivot table on a new sheet. Call the sheet Day - Region Orders and move it
Heatmap
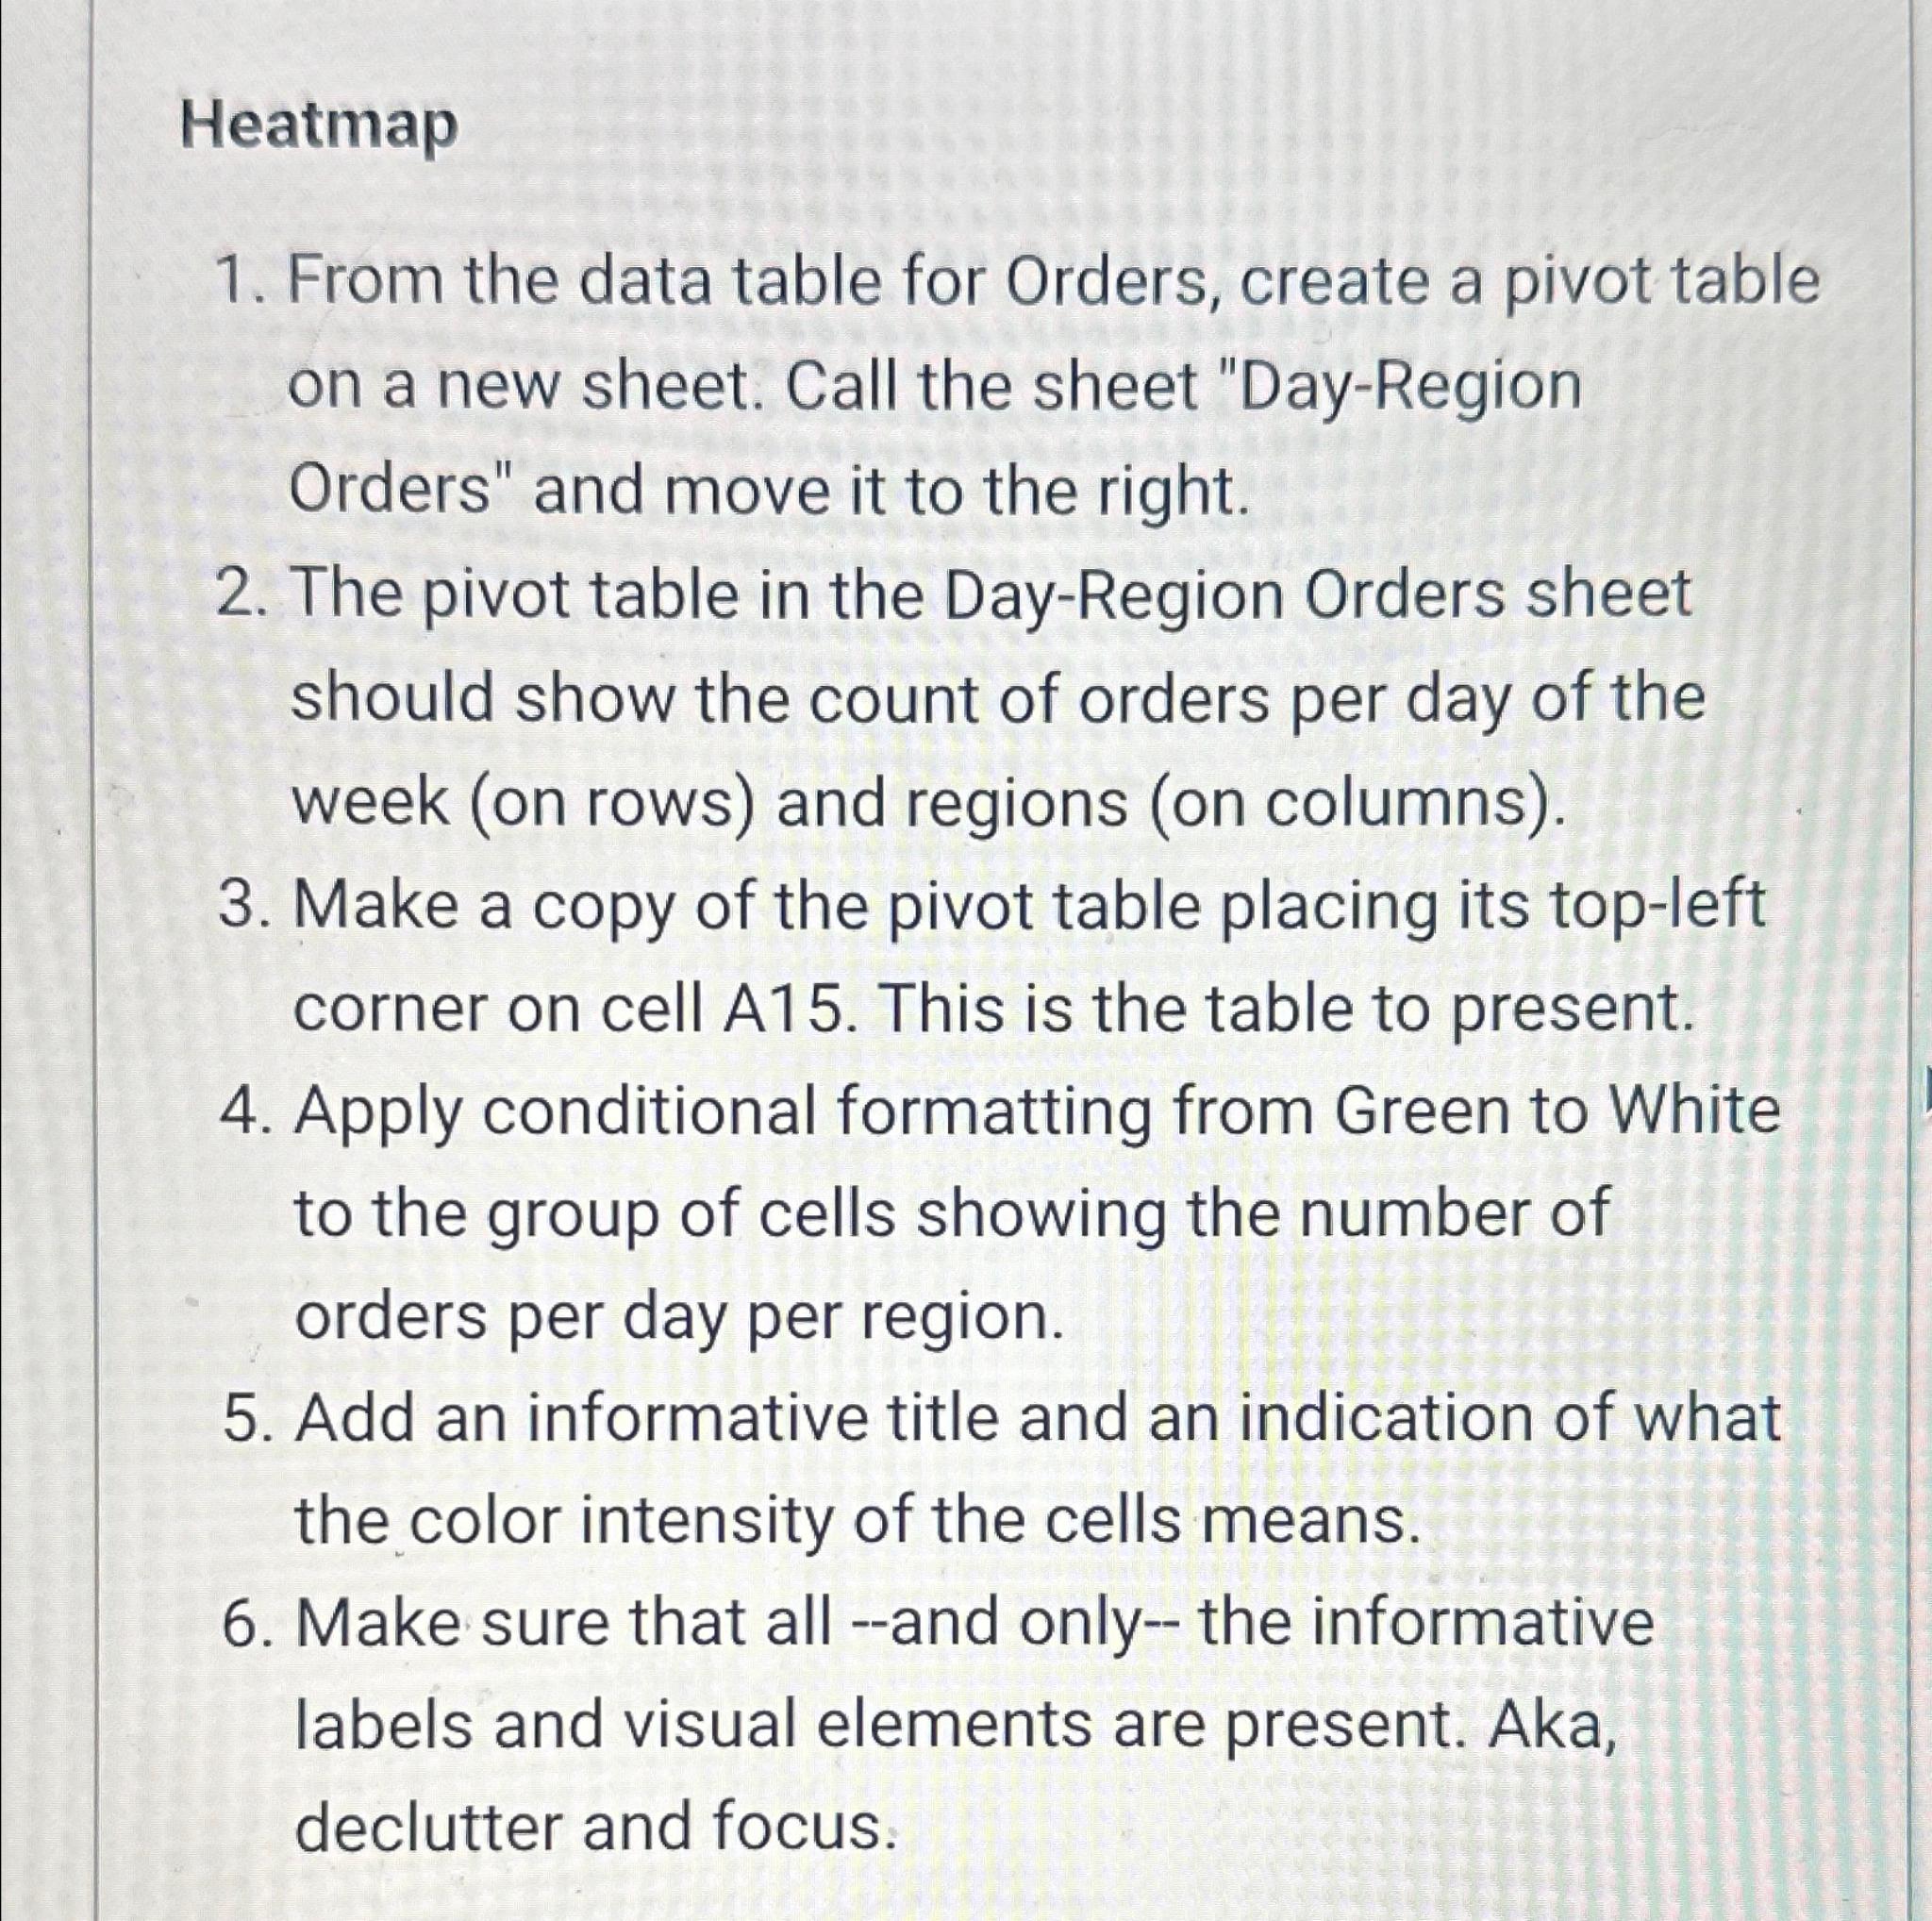
From the data table for Orders, create a pivot table on a new sheet. Call the sheet "DayRegion Orders" and move it to the right.
The pivot table in the DayRegion Orders sheet should show the count of orders per day of the week on rows and regions on columns
Make a copy of the pivot table placing its topleft corner on cell A This is the table to present.
Apply conditional formatting from Green to White to the group of cells showing the number of orders per day per region.
Add an informative title and an indication of what the color intensity of the cells means.
Make sure that all and only the informative labels and visual elements are present. Aka, declutter and focus.
Step by Step Solution
There are 3 Steps involved in it
Step: 1

Get Instant Access to Expert-Tailored Solutions
See step-by-step solutions with expert insights and AI powered tools for academic success
Step: 2

Step: 3
Ace Your Homework with AI
Get the answers you need in no time with our AI-driven, step-by-step assistance
Get Started
Computer Aided Database Design
Authors: Antonio Albano, Valeria De Antonellis, A. Di Leva
1st Edition
0444877355, 978-0444877352