Heckscher-Ohlin (HO) Model Consider a Heckscher-Ohlin (HO) model in which the two countries are the United States and Colombia. For simplicity, assume that the United States is the home country. The two factors of production are labor and capital. Workers and capital owners receive earnings W and R, respectively. The elements Earnings are denominated in U.S. dollars. In this economy, two goods are produced: smartphones (S) and coffee (C). We assume that capital is sufficient in the United States and labor is sufficient in Colombia. Finally, we assume that the technology is the same in both countries, and that the production of smartphones is capital-intensive, while the production of coffee is labor-intensive.

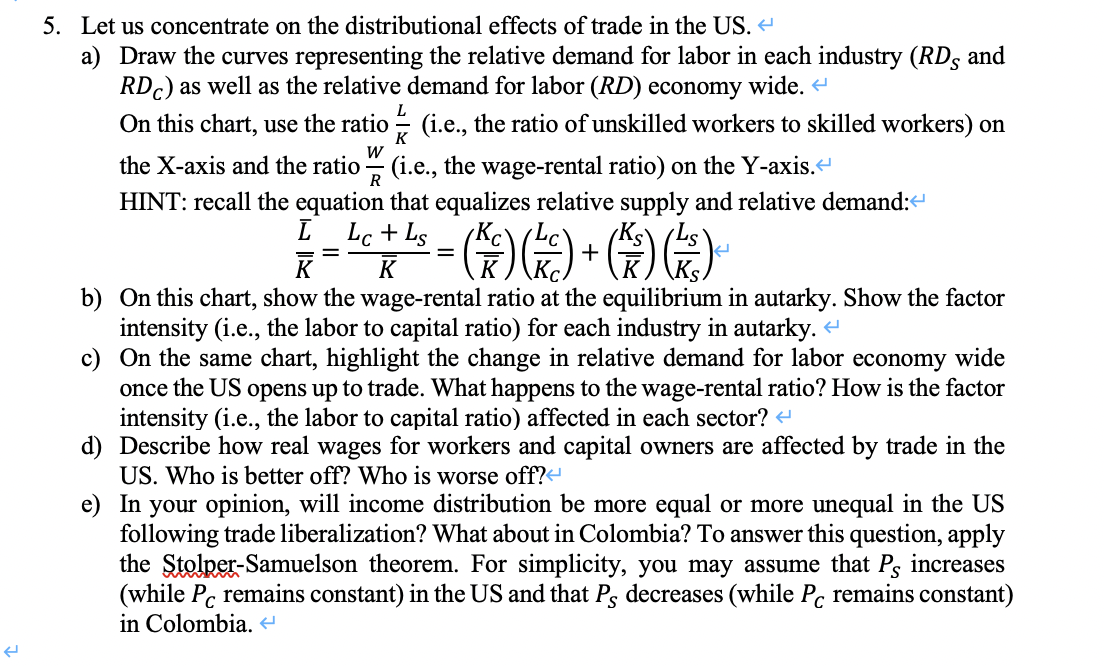
Let us concentrate on the distributional effects of trade in the US. a) Draw the curves representing the relative demand for labor in each industry (RDS and RDC) as well as the relative demand for labor (RD) economy wide. On this chart, use the ratio KL (i.e., the ratio of unskilled workers to skilled workers) on the X-axis and the ratio RW (i.e., the wage-rental ratio) on the Y-axis. HINT: recall the equation that equalizes relative supply and relative demand: KL=KLC+LS=(KKC)(KCLC)+(KKS)(KSLS) b) On this chart, show the wage-rental ratio at the equilibrium in autarky. Show the factor intensity (i.e., the labor to capital ratio) for each industry in autarky. c) On the same chart, highlight the change in relative demand for labor economy wide once the US opens up to trade. What happens to the wage-rental ratio? How is the factor intensity (i.e., the labor to capital ratio) affected in each sector? d) Describe how real wages for workers and capital owners are affected by trade in the US. Who is better off? Who is worse off? e) In your opinion, will income distribution be more equal or more unequal in the US following trade liberalization? What about in Colombia? To answer this question, apply the Stolper-Samuelson theorem. For simplicity, you may assume that PS increases (while PC remains constant) in the US and that PS decreases (while PC remains constant) in Colombia. Let us concentrate on the distributional effects of trade in the US. a) Draw the curves representing the relative demand for labor in each industry (RDS and RDC) as well as the relative demand for labor (RD) economy wide. On this chart, use the ratio KL (i.e., the ratio of unskilled workers to skilled workers) on the X-axis and the ratio RW (i.e., the wage-rental ratio) on the Y-axis. HINT: recall the equation that equalizes relative supply and relative demand: KL=KLC+LS=(KKC)(KCLC)+(KKS)(KSLS) b) On this chart, show the wage-rental ratio at the equilibrium in autarky. Show the factor intensity (i.e., the labor to capital ratio) for each industry in autarky. c) On the same chart, highlight the change in relative demand for labor economy wide once the US opens up to trade. What happens to the wage-rental ratio? How is the factor intensity (i.e., the labor to capital ratio) affected in each sector? d) Describe how real wages for workers and capital owners are affected by trade in the US. Who is better off? Who is worse off? e) In your opinion, will income distribution be more equal or more unequal in the US following trade liberalization? What about in Colombia? To answer this question, apply the Stolper-Samuelson theorem. For simplicity, you may assume that PS increases (while PC remains constant) in the US and that PS decreases (while PC remains constant) in Colombia


