

Answered step by step
Verified Expert Solution
Question
1 Approved Answer
6.2.4 WP An article in Technometrics [Validation of Regres- sion Models: Methods and Examples (1977, Vol. 19(4), p. 425)] presented the following data on
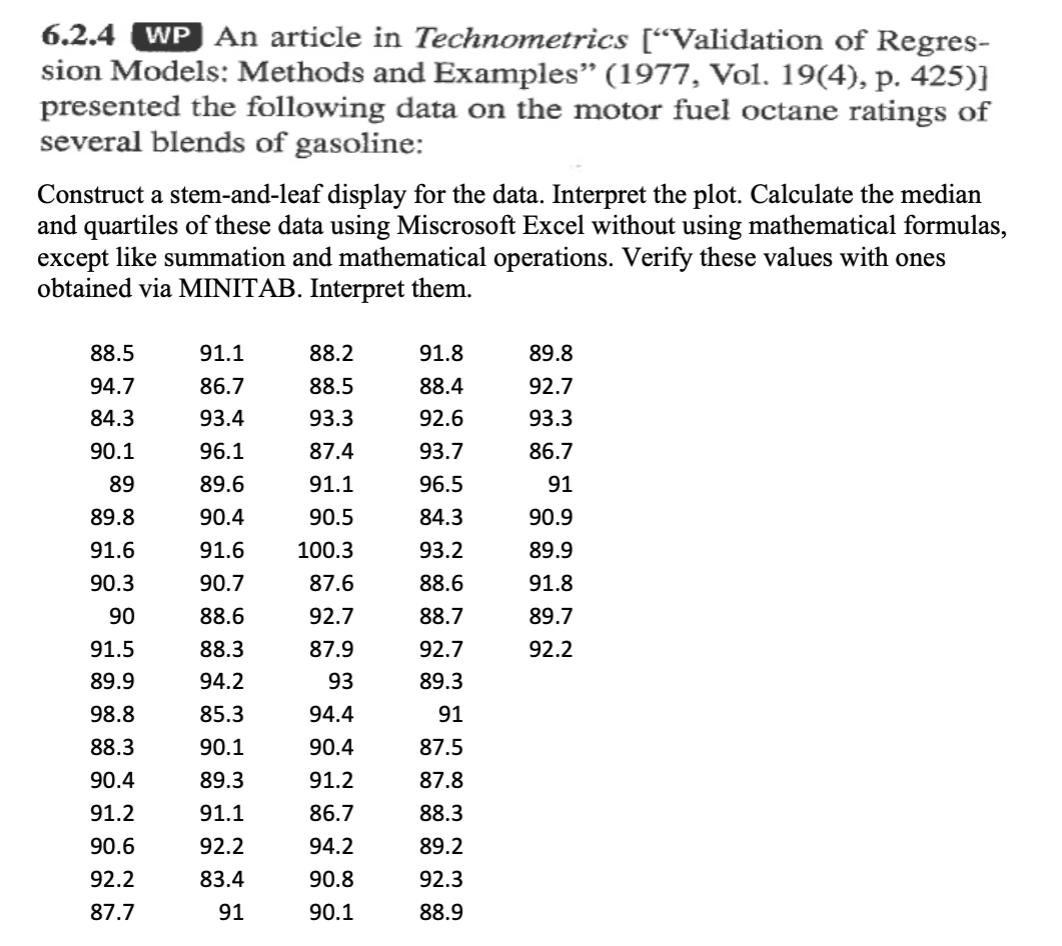
6.2.4 WP An article in Technometrics ["Validation of Regres- sion Models: Methods and Examples" (1977, Vol. 19(4), p. 425)] presented the following data on the motor fuel octane ratings of several blends of gasoline: Construct a stem-and-leaf display for the data. Interpret the plot. Calculate the median and quartiles of these data using Miscrosoft Excel without using mathematical formulas, except like summation and mathematical operations. Verify these values with ones obtained via MINITAB. Interpret them. 88.5 91.1 88.2 91.8 89.8 94.7 86.7 88.5 88.4 92.7 84.3 93.4 93.3 92.6 93.3 90.1 96.1 87.4 93.7 86.7 89 89.6 91.1 96.5 91 89.8 90.4 90.5 84.3 90.9 91.6 91.6 100.3 93.2 89.9 90.3 90.7 87.6 88.6 91.8 90 88.6 92.7 88.7 89.7 91.5 88.3 87.9 92.7 92.2 89.9 94.2 93 89.3 98.8 85.3 94.4 91 88.3 90.1 90.4 87.5 90.4 89.3 91.2 87.8 91.2 91.1 86.7 88.3 90.6 92.2 94.2 89.2 92.2 83.4 90.8 92.3 87.7 91 90.1 88.9
Step by Step Solution
There are 3 Steps involved in it
Step: 1
Construct a StemandLeaf Display for the Data To create a stemandleaf plot well break each value into a stem and a leaf In this case well use the tens ...
Get Instant Access to Expert-Tailored Solutions
See step-by-step solutions with expert insights and AI powered tools for academic success
Step: 2

Step: 3
Ace Your Homework with AI
Get the answers you need in no time with our AI-driven, step-by-step assistance
Get Started
Elementary Algebra
Authors: Charles P McKeague
3rd Edition
1483263843, 9781483263847