Hello, Attached are some problems and table 2. I need help with these problems. Thanks.
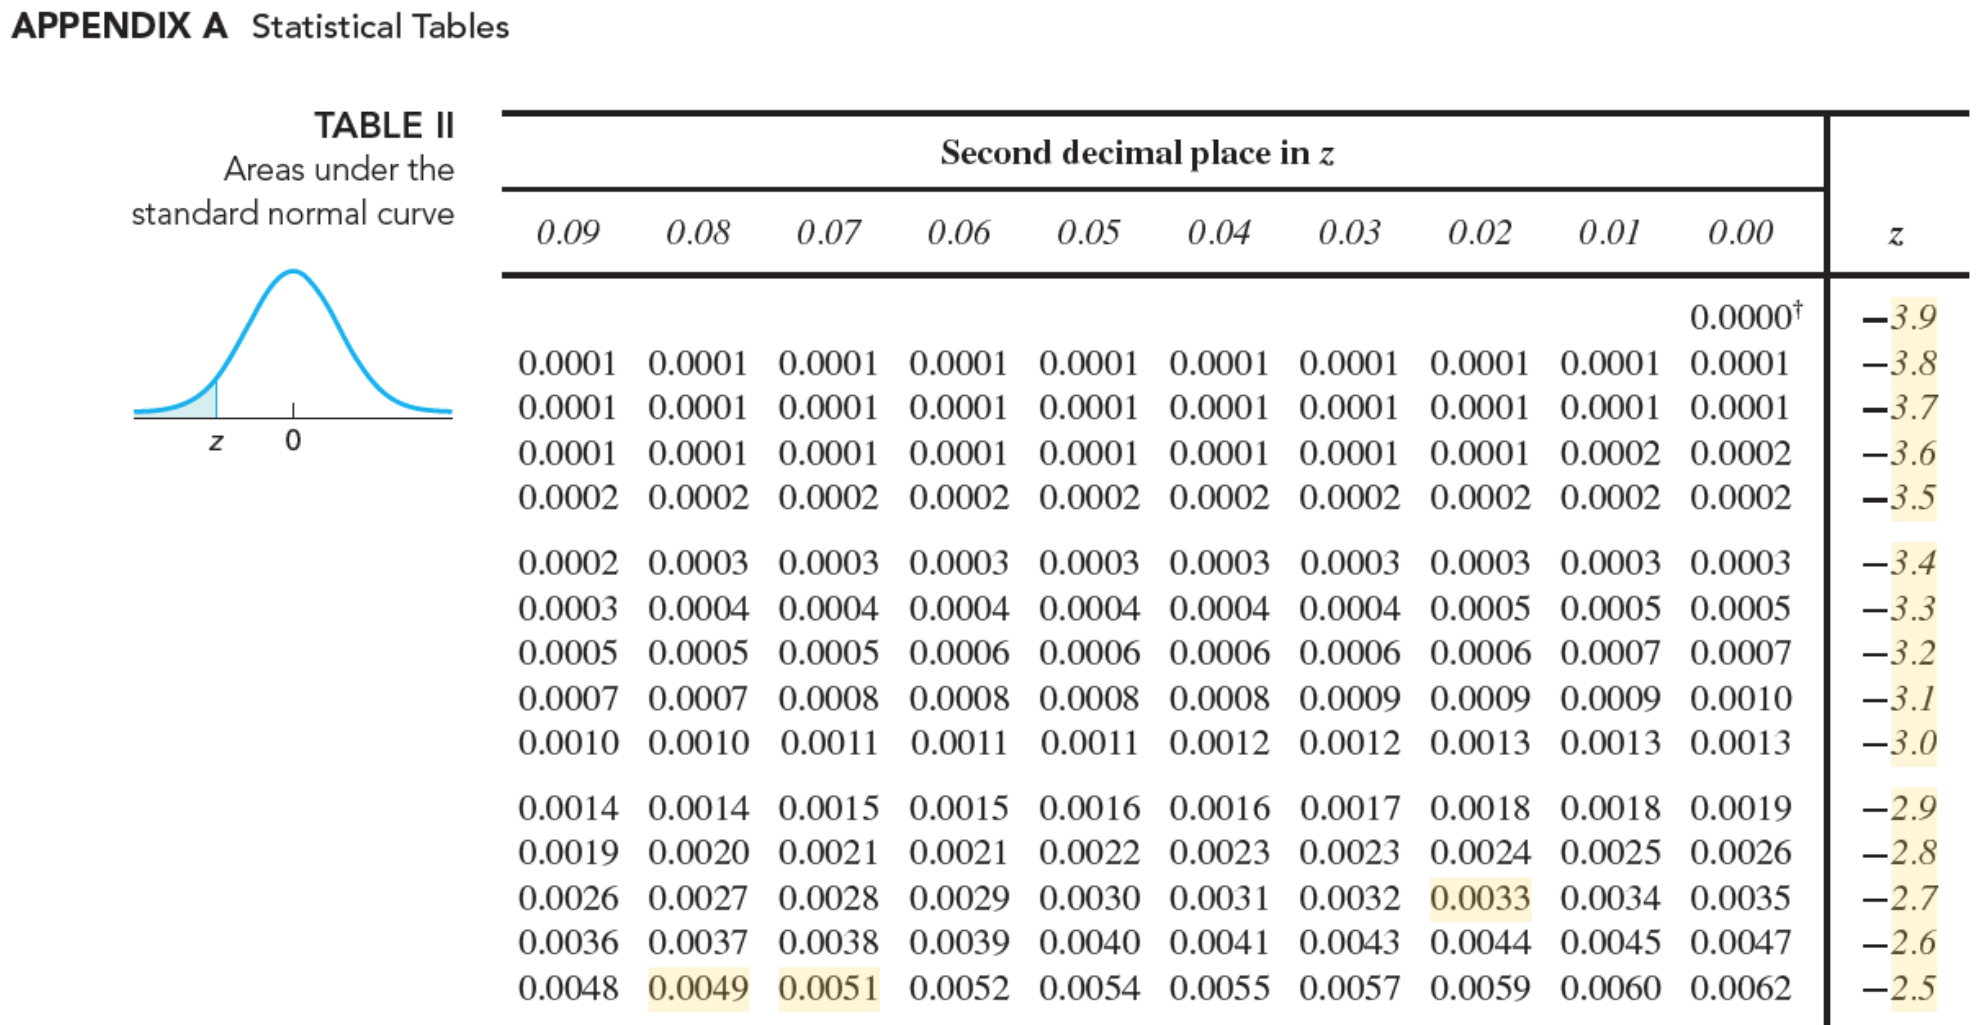
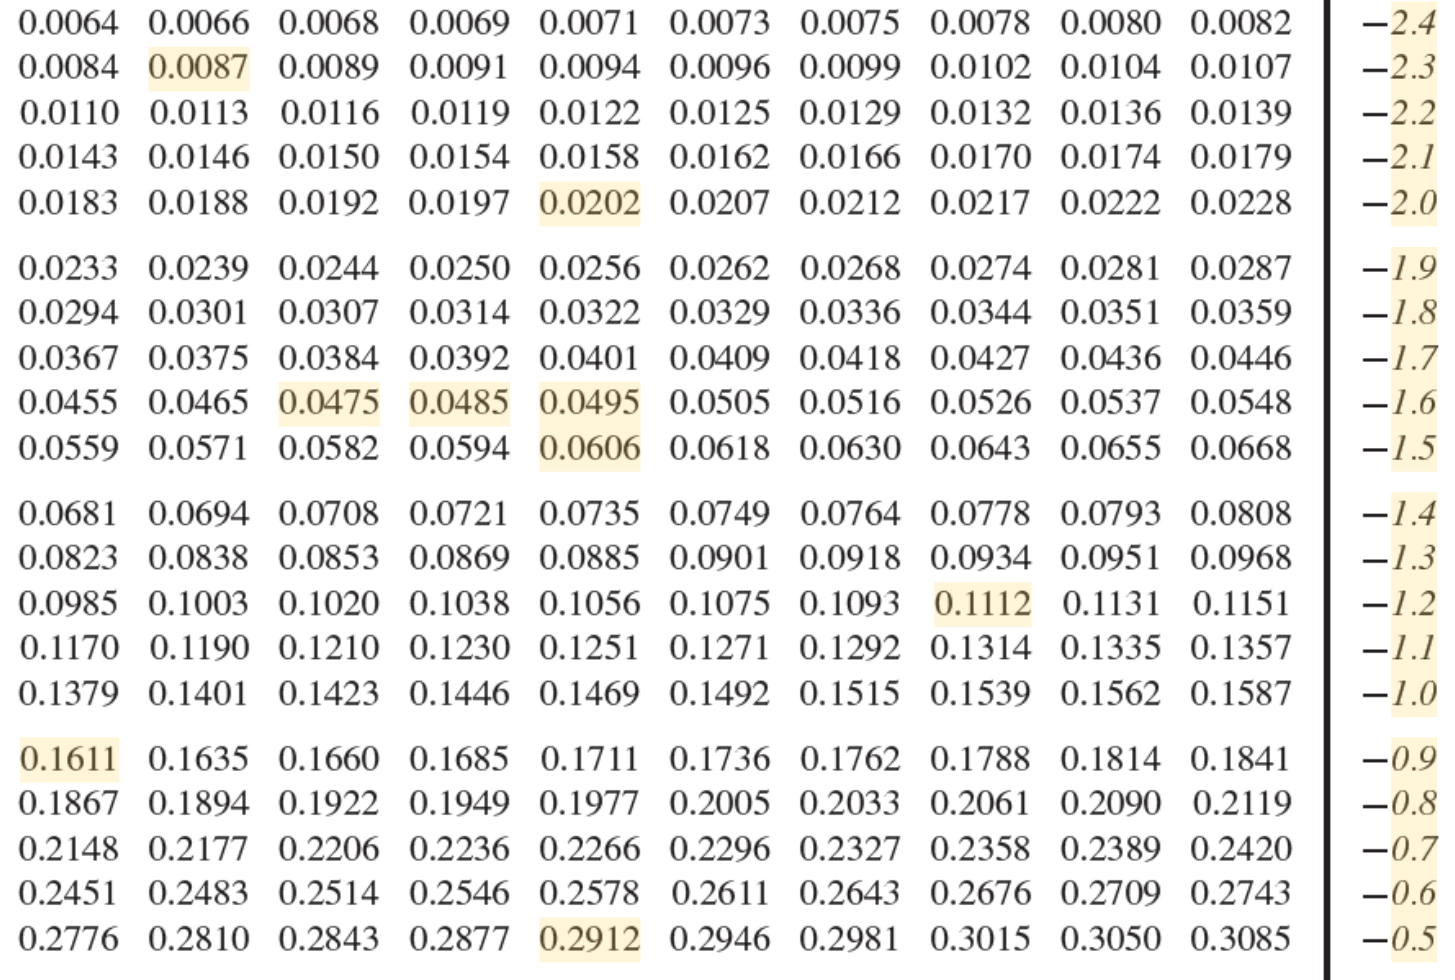
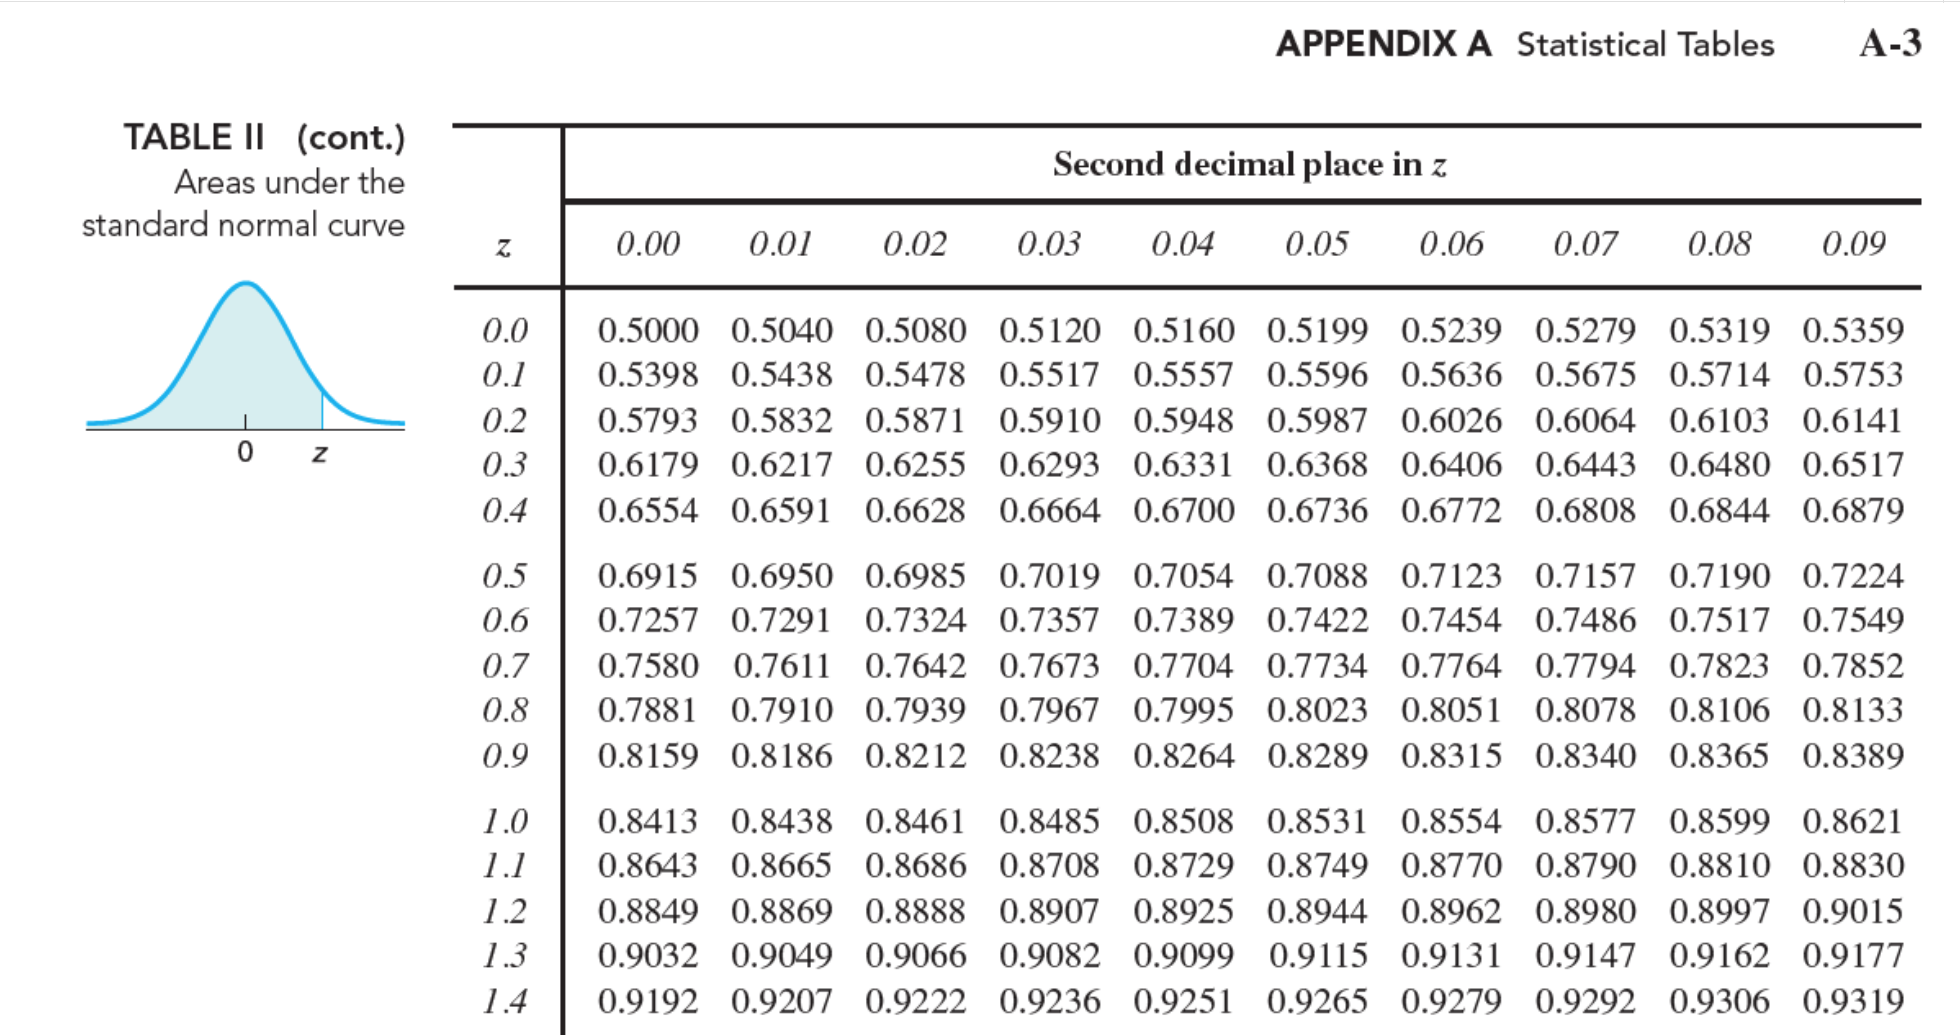
6. Use a table of areas for the standard normal curve to find the required z-score. Determine the two z-scores that divide the area under the standard normal curve into a middle 0.874 area and two outside 0.063 areas. -1.39, 1.39 -1.46, 1.46 -1.45, 1.45 -1.53, 1.53 7. Fill in the blanks by standardizing the normally distributed variable. The amount of time that customers wait in line during peak hours at one bank is normally distributed with a mean of 15 minutes and a standard deviation of 3 minutes. The percentage of time that the waiting time exceeds 16 minutes is equal to the area under the standard normal curve that lies to the ___ of ___ left, 0.33 left, 0.87 right, 0.33 right, -0.33 8. Fill in the blanks by standardizing the normally distributed variable. Dave drives to work each morning at about the same time. His commute time is normally distributed with a mean of 46 minutes and a standard deviation of 5 minutes. The percentage of time that his commute time exceeds 58 minutes is equal to the area under the standard normal curve that lies to the ___ of ___. right, 2.4 left, 2.4 right, 12 left, 1.2 9. Use a table of areas for the standard normal curve to find the required z-score. Find the z-score for which the area under the standard normal curve to its left is 0.40 0.25 0.57 -0.57 -0.25 APPENDIX A Statistical Tables TABLE II Areas under the standard normal curve 0.09 0.0001 0.0001 0.0001 0.0002 0.0002 0.0003 0.0005 0.0007 0.0010 0.0014 0.0019 0.0026 0.0036 0.0048 0.08 0.0001 0.0001 0.0001 0.0002 0.0003 0.0004 0.0005 0.0007 0.0010 0.00 14 0.0020 0.0027 0.0037 0.0049 0.07 0.000 1 0.000 1 0.000 1 0.0002 0.0003 0.0004 0.0005 0.0008 0.001 1 0.001 5 0.002 1 0.0028 0.0038 0.005 1 Second decimal place in z 0.06 0.0001 0.0001 0.0001 0.0002 0.0003 0.0004 0.0006 0.0008 0.0011 0.0015 0.0021 0.0029 0.0039 0.0052 0.05 0.0001 0.0001 0.0001 0.0002 0.0003 0.0004 0.0006 0.0008 0.0011 0. 00 l 6 0.0022 0.0030 0.0040 0.0054 0.04 0.000 1 0.000 1 0.000 1 0.0002 0.0003 0.0004 0 0006 0.0008 0.0012 0.0016 0.0023 0.003 1 0.0041 0.0055 0.03 0.0001 0.0001 0.0001 0.0002 0.0003 0.0004 0.0006 0.0009 0.0012 0.0017 0.0023 0.0032 0.0043 0.0057 0.02 0.0001 0.0001 0.0001 0.0002 0.0003 0.0005 0.0006 0.0009 0.0013 0.0018 0.0024 0.0033 0.0044 0.0059 0.01 0.0001 0.0001 0.0002 0.0002 0.0003 0.0005 0.0007 0.0009 0.0013 0.0018 0.0025 0.0034 0.0045 0.0060 0.00 0.0000'r 0.0001 0.0001 0.0002 0.0002 0.0003 0.0005 0.0007 0.0010 0.0013 0.0019 0.0026 0.0035 0.0047 0.0062 3.9 3.8 3.7 3.6 3.5 3.4 3.3 3.2 3.1 3.0 2.9 2.8 2.7 2.6 2.5 \f\fTABLE II (cont) Areas under the standard normal curve 0.0 0.1 0.2 0.3 0.4 0.5 0.6 0. 7 0.8 0.9 1.0 1.1 1.2 1.3 1.4 0.00 0.5000 0.5398 0.5793 0.6179 0.6554 0.6915 0.7257 0.7580 0.7881 0.8159 0.8413 0.8643 0.8849 0.9032 0.9192 0.01 0.5040 0.5438 0.5832 0.6217 0.6591 0.6950 0.7291 0.7611 0.7910 0.8186 0.8438 0.8665 0.8869 0.9049 0.9207 0.02 0.5080 0.5478 0.5871 0.6255 0.6628 0.6985 0.7324 0.7642 0.7939 0. 8212 0. 8461 0. 8686 0. 8888 0.9066 0.9222 APPENDIX A Statistical Tables Second decimal place in z 0.03 0.5120 0.5517 0.5910 0.6293 0.6664 0.7019 0.7357 0.7673 0.7967 0. 8238 0.8485 0.8708 0.8907 0.9082 0.9236 0.04 0.5160 0.5557 0.5948 0.6331 0.6700 0.7054 0.73 89 0.7704 0.7995 0. 8264 0.8508 0.8729 0.8925 0.9099 0.925 1 0.05 0.5199 0.5596 0.5987 0.6368 0.6736 0.7088 0.7422 0.7734 0.8023 0.8289 0.853 1 0.8749 0.8944 0.9 1 1 5 0.9265 0.06 0.5239 0.5636 0.6026 0 6406 0.67 72 0.7123 0.7454 0.7764 0.805 1 0.83 l 5 0.8554 0.8770 0.8962 0.913 1 0.9279 0.07 0.5279 0.5675 0.6064 0.6443 0.6808 0.7157 0.7486 0.7794 0.8078 0.8340 0.8577 0.8790 0.8980 0.9147 0.9292 0.08 0.5319 0.5714 0.6103 0.6480 0.6844 0.7190 0.7517 0.7823 0.8106 0.8365 0.8599 0.8810 0.8997 0.9 162 0.9306 A-3 0.09 0.5359 0.5753 0.6141 0.6517 0.6879 0.7224 0.7549 0.7852 0.8133 0.8389 0.8621 0.8830 0.9015 0.9177 0.9319 \f\f


