Hello, Attached are some problems and the table for it. I need help with these problems. Thanks.
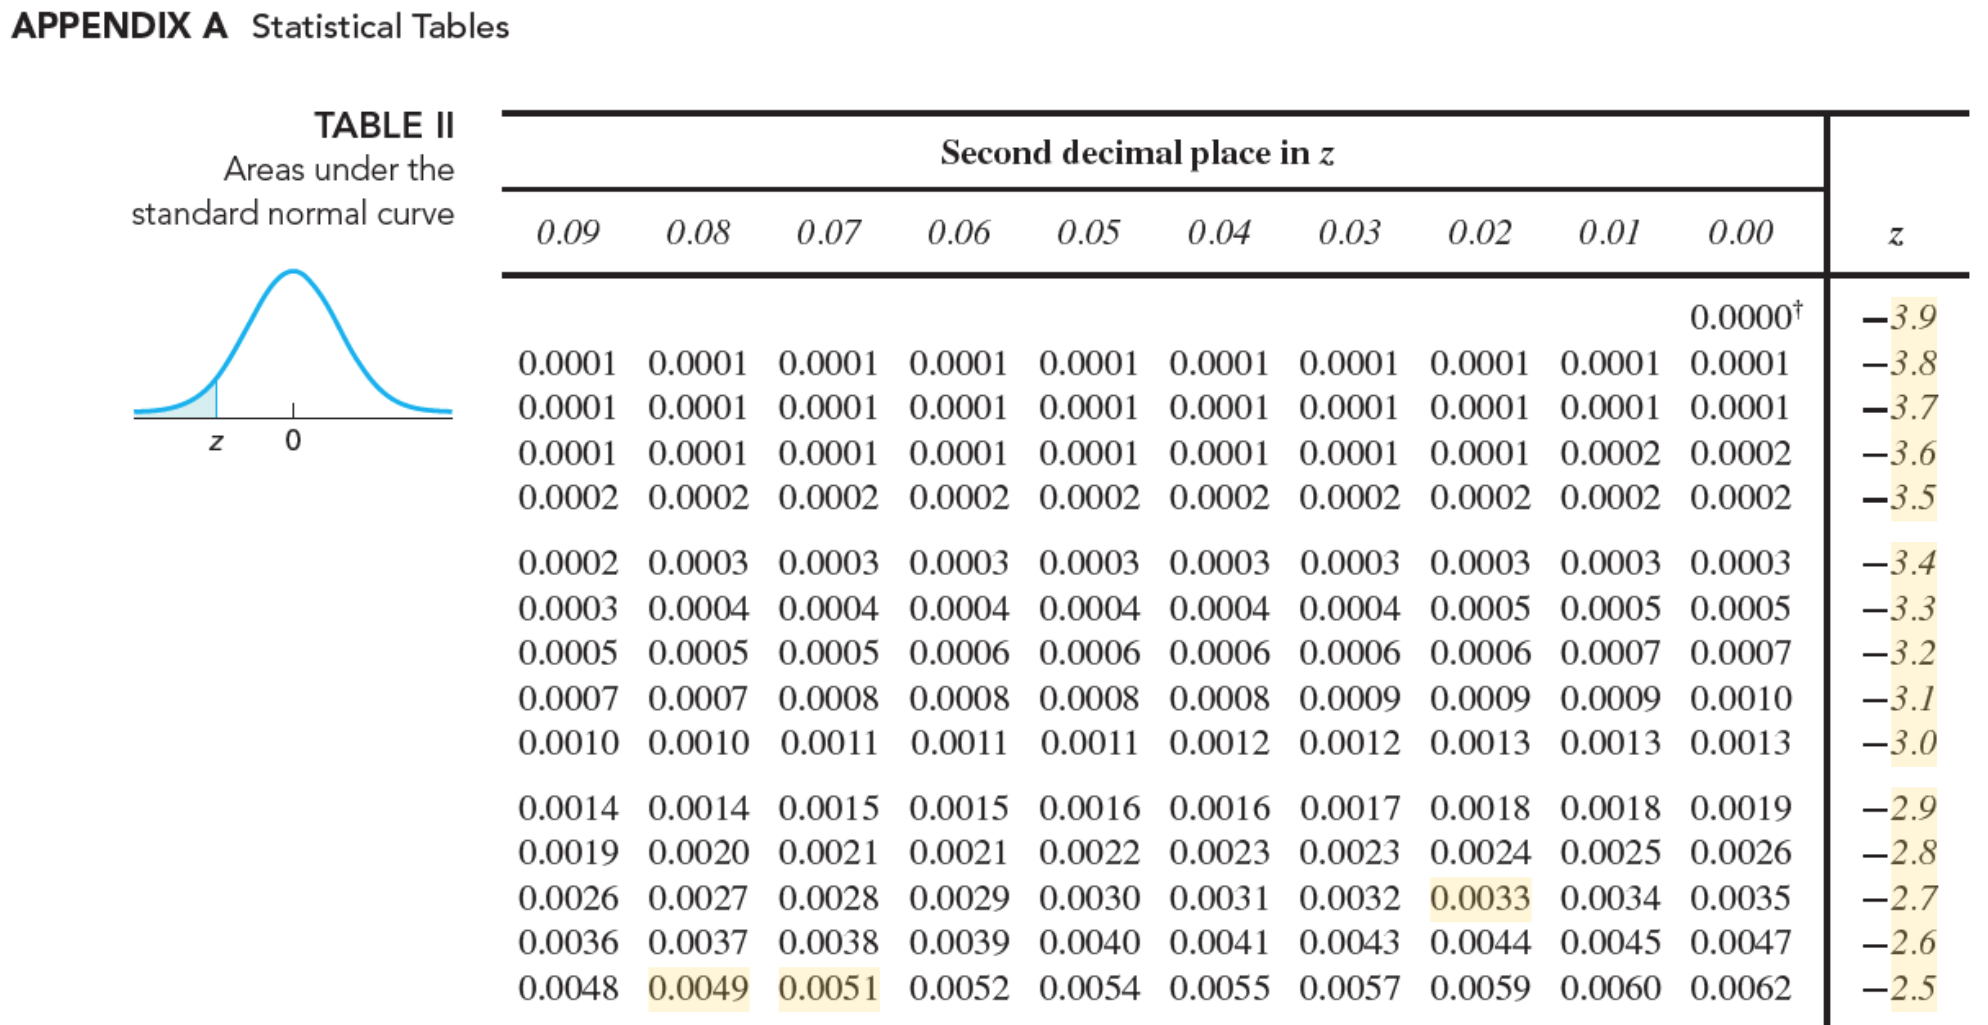
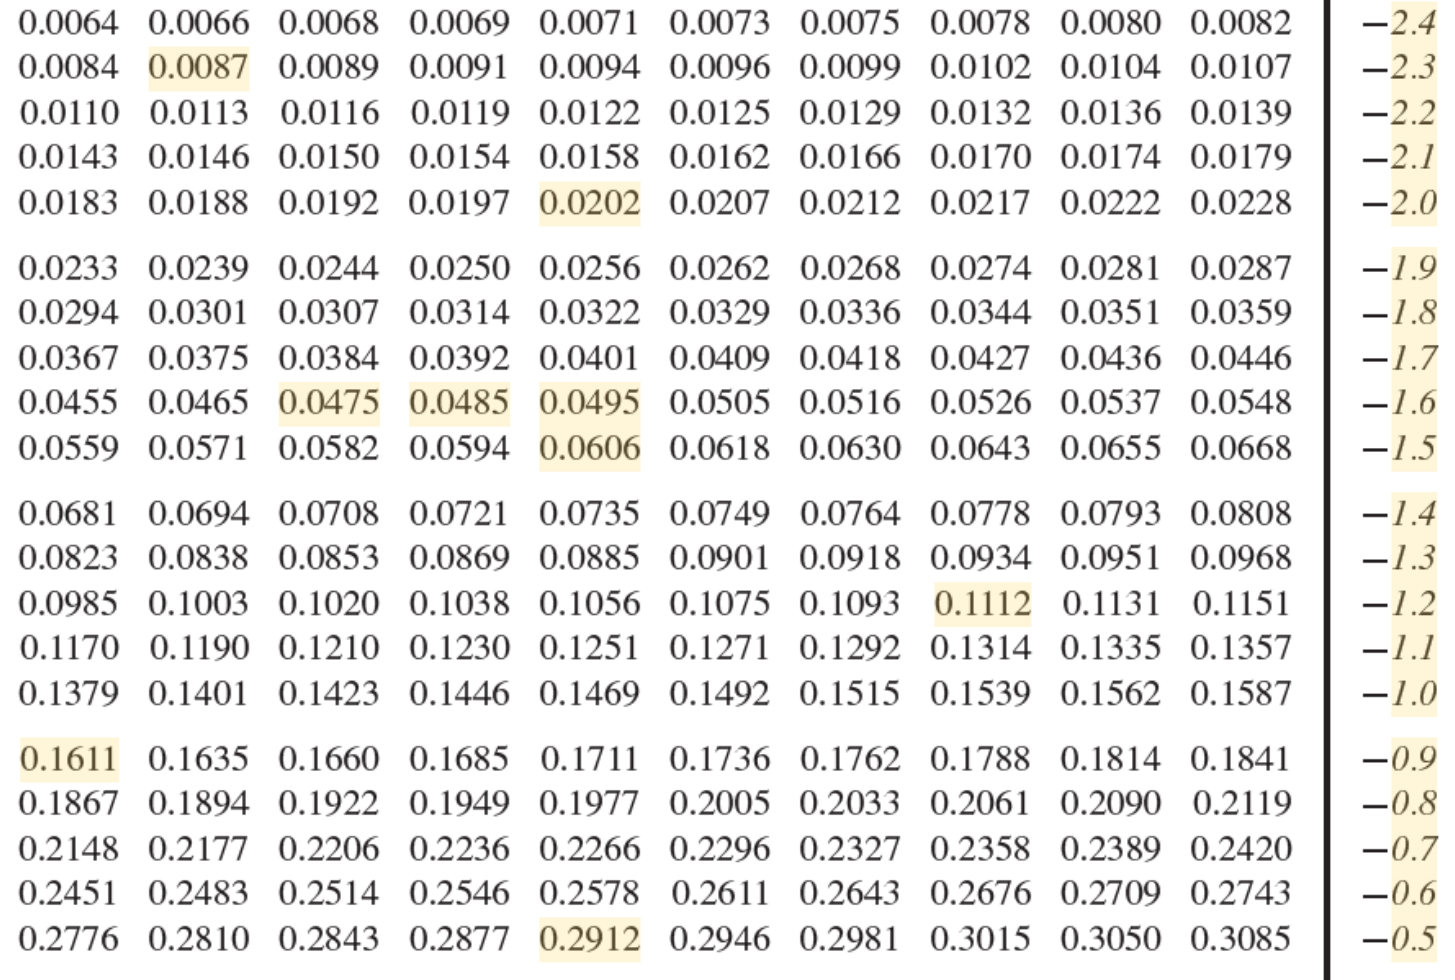
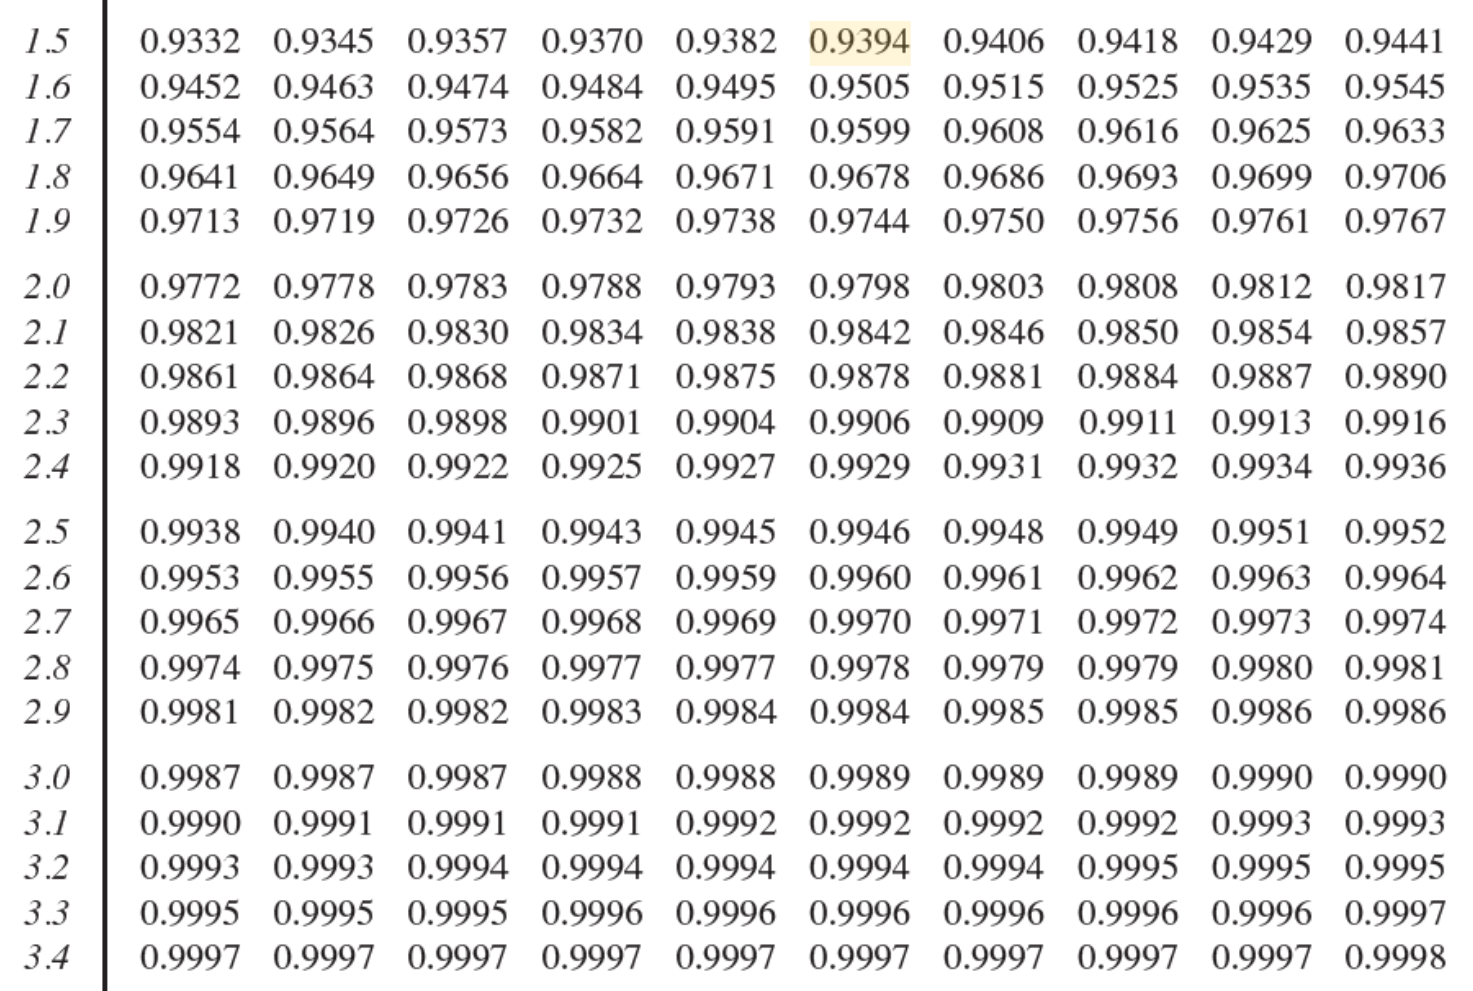
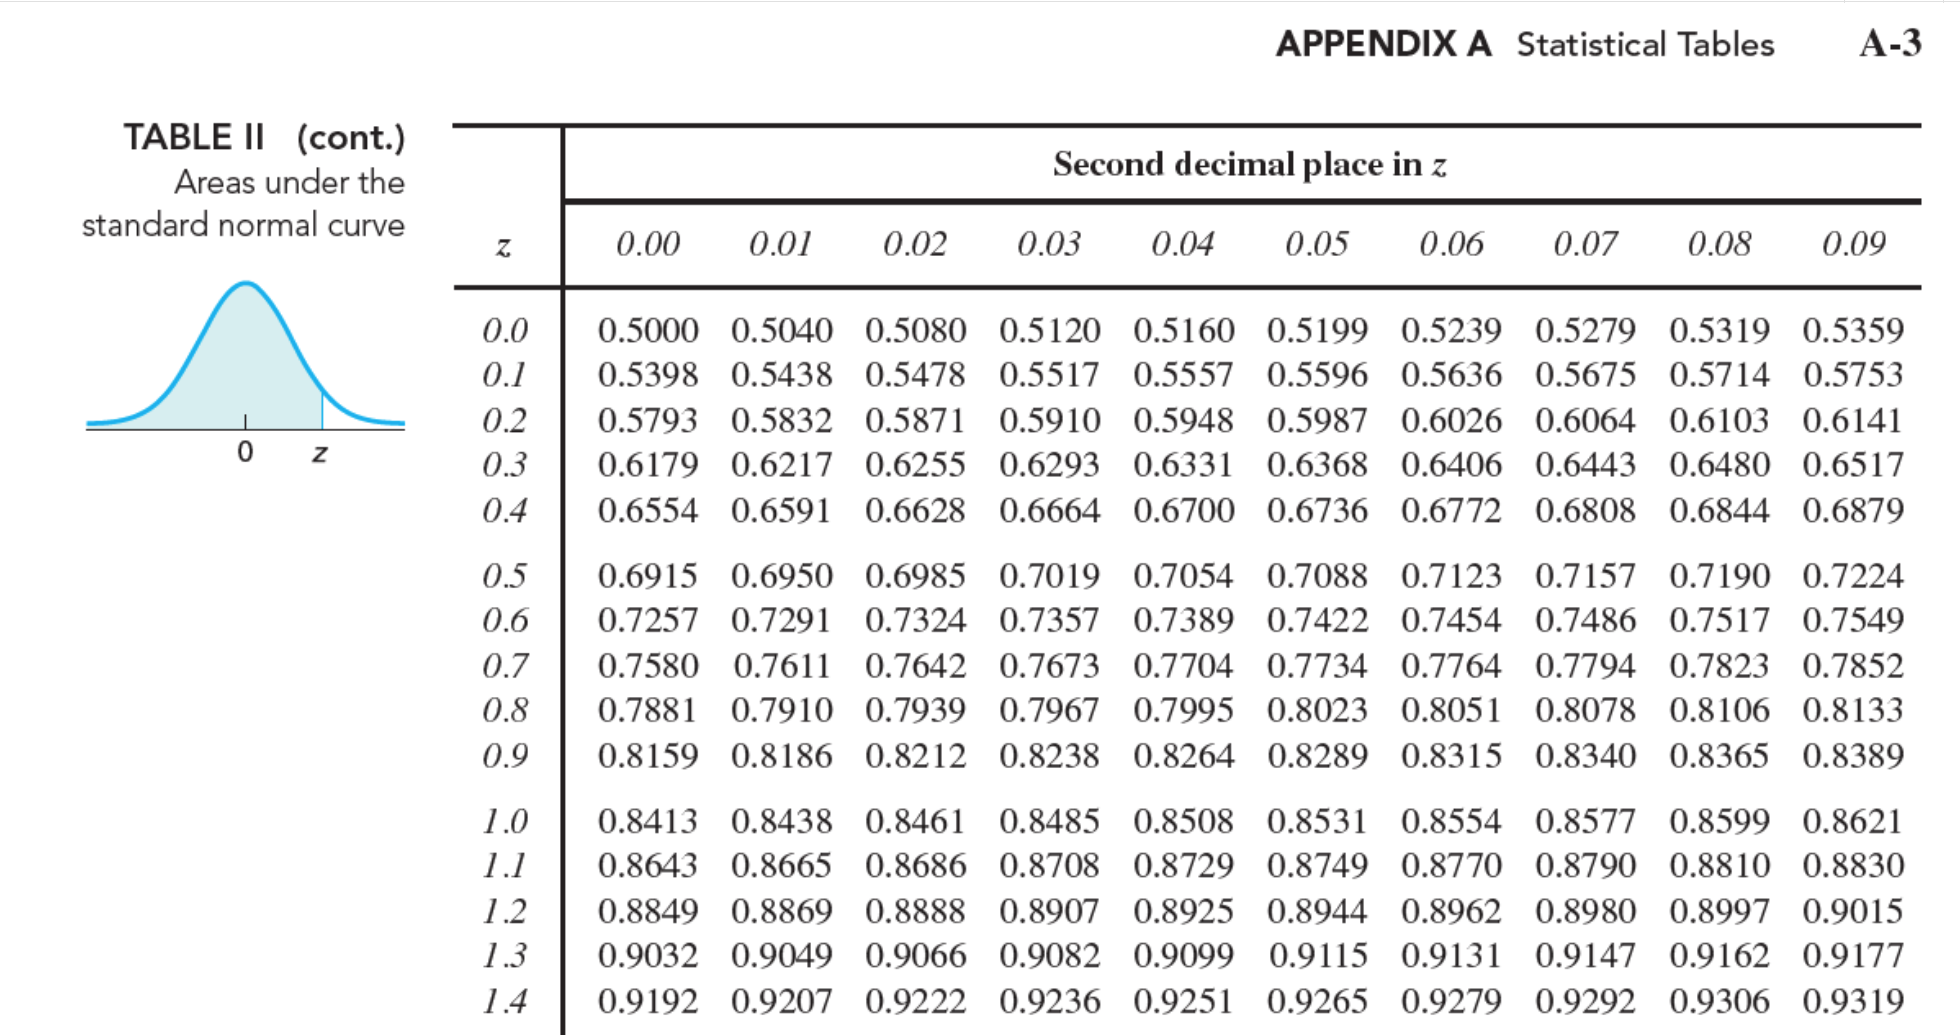
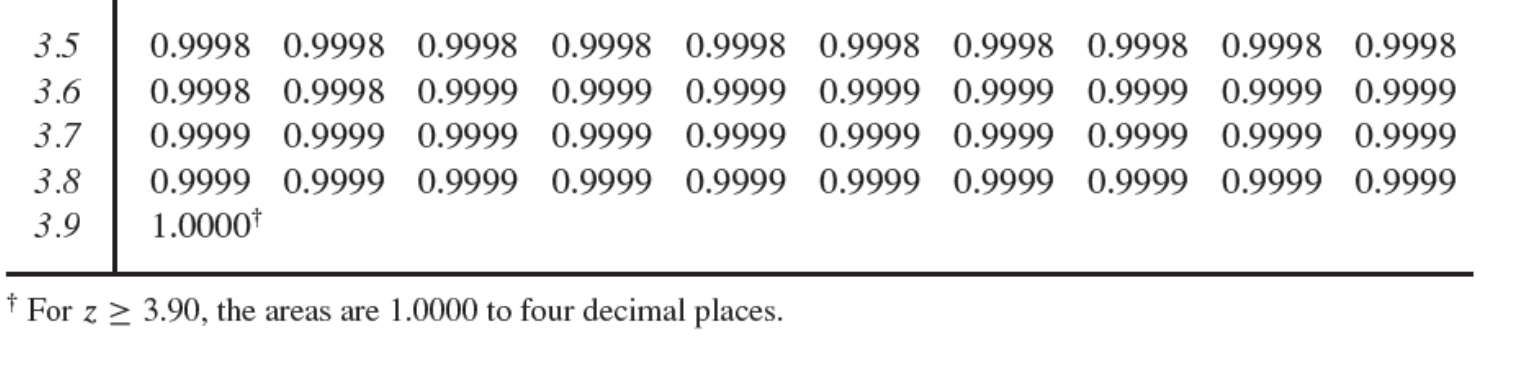
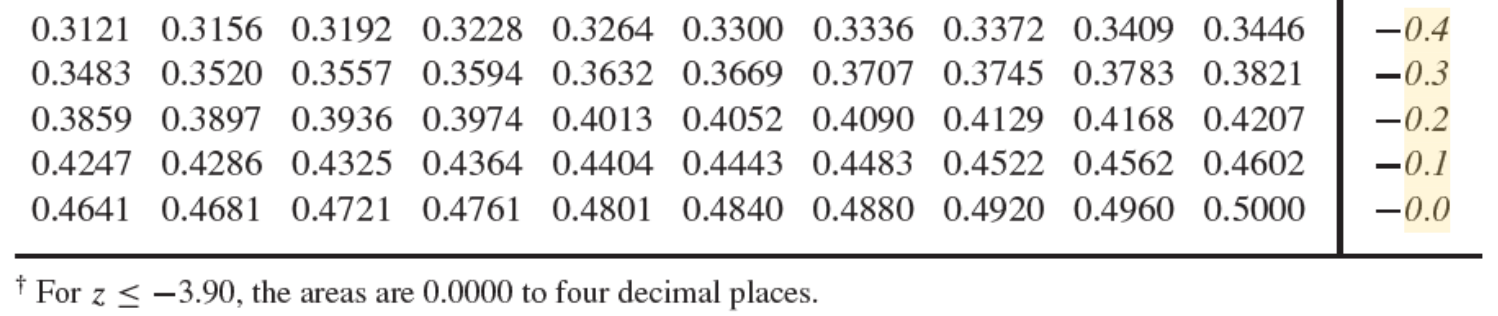
10. Find the indicated probability. Round to four decimal places. A machine has 12 identical components which function independently. The probability that a component will fail is 0.2. The machine will stop working if more than three components fail. Find the probability that the machine will be working. 0.2054 0.7946 0.2362 0.7638 11. Use a table of areas to obtain the shaded area under the standard normal curve. 0.0208 0.9896 0.0104 0.9792 12. Find the indicated probability. Round to four decimal places. In one city, the probability that a person will pass his or her driving test on the first attempt is 0.65. 11 people are selected at random from among those taking their driving test for the first time. What is the probability that among these 11 people, the number passing the test is between 2 and 4 inclusive? 0.0481 0.0557 0.0397 0.0499 13. Find the standard deviation of the binomial random variable. The probability that a radish seed will germinate is 0.7. A gardener plants seeds in batches of 13. Find the standard deviation for the random variable X, the number of seeds germinating in each batch. 1.632 1.652 1.587 1.568 APPENDIX A Statistical Tables TABLE II Areas under the standard normal curve 0.09 0.0001 0.0001 0.0001 0.0002 0.0002 0.0003 0.0005 0.0007 0.0010 0.0014 0.0019 0.0026 0.0036 0.0048 0.08 0.0001 0.0001 0.0001 0.0002 0.0003 0.0004 0.0005 0.0007 0.0010 0.00 14 0.0020 0.0027 0.0037 0.0049 0.07 0.000 1 0.000 1 0.000 1 0.0002 0.0003 0.0004 0.0005 0.0008 0.001 1 0.001 5 0.002 1 0.0028 0.0038 0.005 1 Second decimal place in z 0.06 0.0001 0.0001 0.0001 0.0002 0.0003 0.0004 0.0006 0.0008 0.0011 0.0015 0.0021 0.0029 0.0039 0.0052 0.05 0.0001 0.0001 0.0001 0.0002 0.0003 0.0004 0.0006 0.0008 0.0011 0. 00 l 6 0.0022 0.0030 0.0040 0.0054 0.04 0.000 1 0.000 1 0.000 1 0.0002 0.0003 0.0004 0 0006 0.0008 0.0012 0.0016 0.0023 0.003 1 0.0041 0.0055 0.03 0.0001 0.0001 0.0001 0.0002 0.0003 0.0004 0.0006 0.0009 0.0012 0.0017 0.0023 0.0032 0.0043 0.0057 0.02 0.0001 0.0001 0.0001 0.0002 0.0003 0.0005 0.0006 0.0009 0.0013 0.0018 0.0024 0.0033 0.0044 0.0059 0.01 0.0001 0.0001 0.0002 0.0002 0.0003 0.0005 0.0007 0.0009 0.0013 0.0018 0.0025 0.0034 0.0045 0.0060 0.00 0.0000'r 0.0001 0.0001 0.0002 0.0002 0.0003 0.0005 0.0007 0.0010 0.0013 0.0019 0.0026 0.0035 0.0047 0.0062 3.9 3.8 3.7 3.6 3.5 3.4 3.3 3.2 3.1 3.0 2.9 2.8 2.7 2.6 2.5 \f\fTABLE II (cont) Areas under the standard normal curve 0.0 0.1 0.2 0.3 0.4 0.5 0.6 0. 7 0.8 0.9 1.0 1.1 1.2 1.3 1.4 0.00 0.5000 0.5398 0.5793 0.6179 0.6554 0.6915 0.7257 0.7580 0.7881 0.8159 0.8413 0.8643 0.8849 0.9032 0.9192 0.01 0.5040 0.5438 0.5832 0.6217 0.6591 0.6950 0.7291 0.7611 0.7910 0.8186 0.8438 0.8665 0.8869 0.9049 0.9207 0.02 0.5080 0.5478 0.5871 0.6255 0.6628 0.6985 0.7324 0.7642 0.7939 0. 8212 0. 8461 0. 8686 0. 8888 0.9066 0.9222 APPENDIX A Statistical Tables Second decimal place in z 0.03 0.5120 0.5517 0.5910 0.6293 0.6664 0.7019 0.7357 0.7673 0.7967 0. 8238 0.8485 0.8708 0.8907 0.9082 0.9236 0.04 0.5160 0.5557 0.5948 0.6331 0.6700 0.7054 0.73 89 0.7704 0.7995 0. 8264 0.8508 0.8729 0.8925 0.9099 0.925 1 0.05 0.5199 0.5596 0.5987 0.6368 0.6736 0.7088 0.7422 0.7734 0.8023 0.8289 0.853 1 0.8749 0.8944 0.9 1 1 5 0.9265 0.06 0.5239 0.5636 0.6026 0 6406 0.67 72 0.7123 0.7454 0.7764 0.805 1 0.83 l 5 0.8554 0.8770 0.8962 0.913 1 0.9279 0.07 0.5279 0.5675 0.6064 0.6443 0.6808 0.7157 0.7486 0.7794 0.8078 0.8340 0.8577 0.8790 0.8980 0.9147 0.9292 0.08 0.5319 0.5714 0.6103 0.6480 0.6844 0.7190 0.7517 0.7823 0.8106 0.8365 0.8599 0.8810 0.8997 0.9 162 0.9306 A-3 0.09 0.5359 0.5753 0.6141 0.6517 0.6879 0.7224 0.7549 0.7852 0.8133 0.8389 0.8621 0.8830 0.9015 0.9177 0.9319 \f\f