Hello,
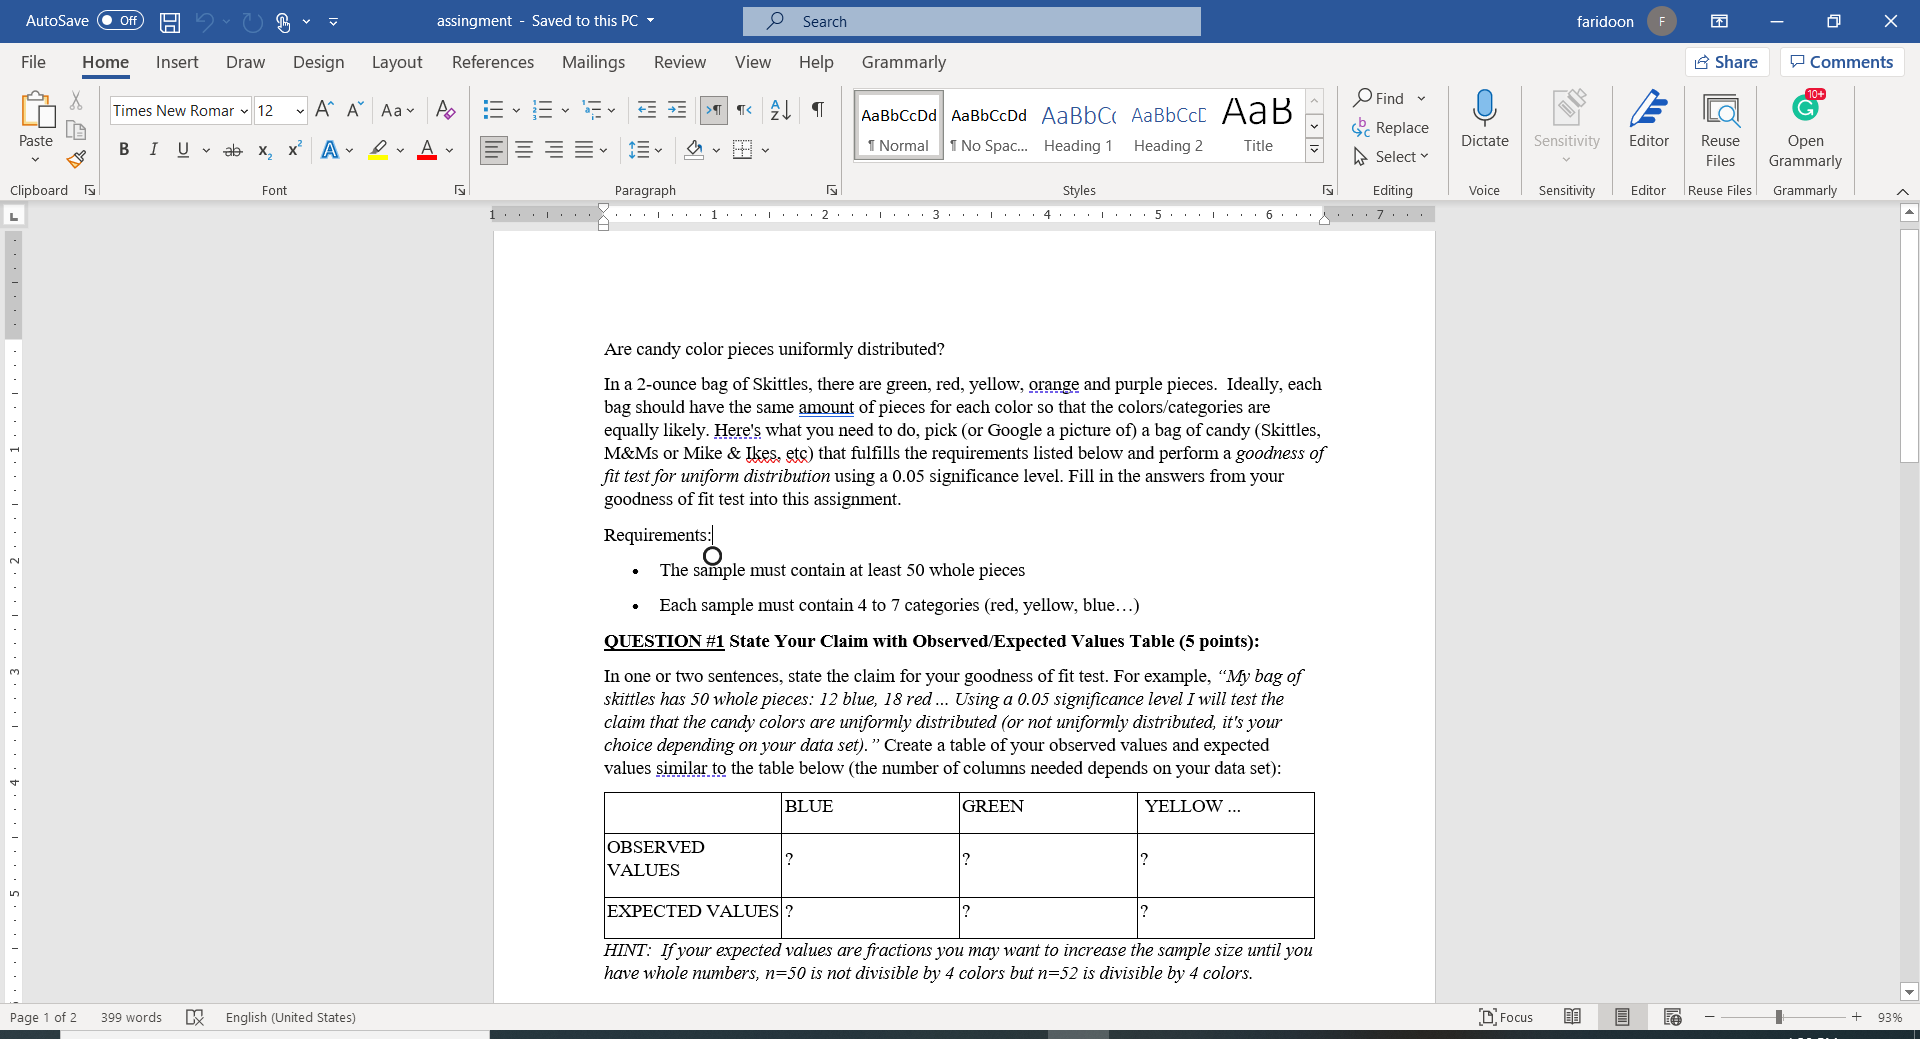
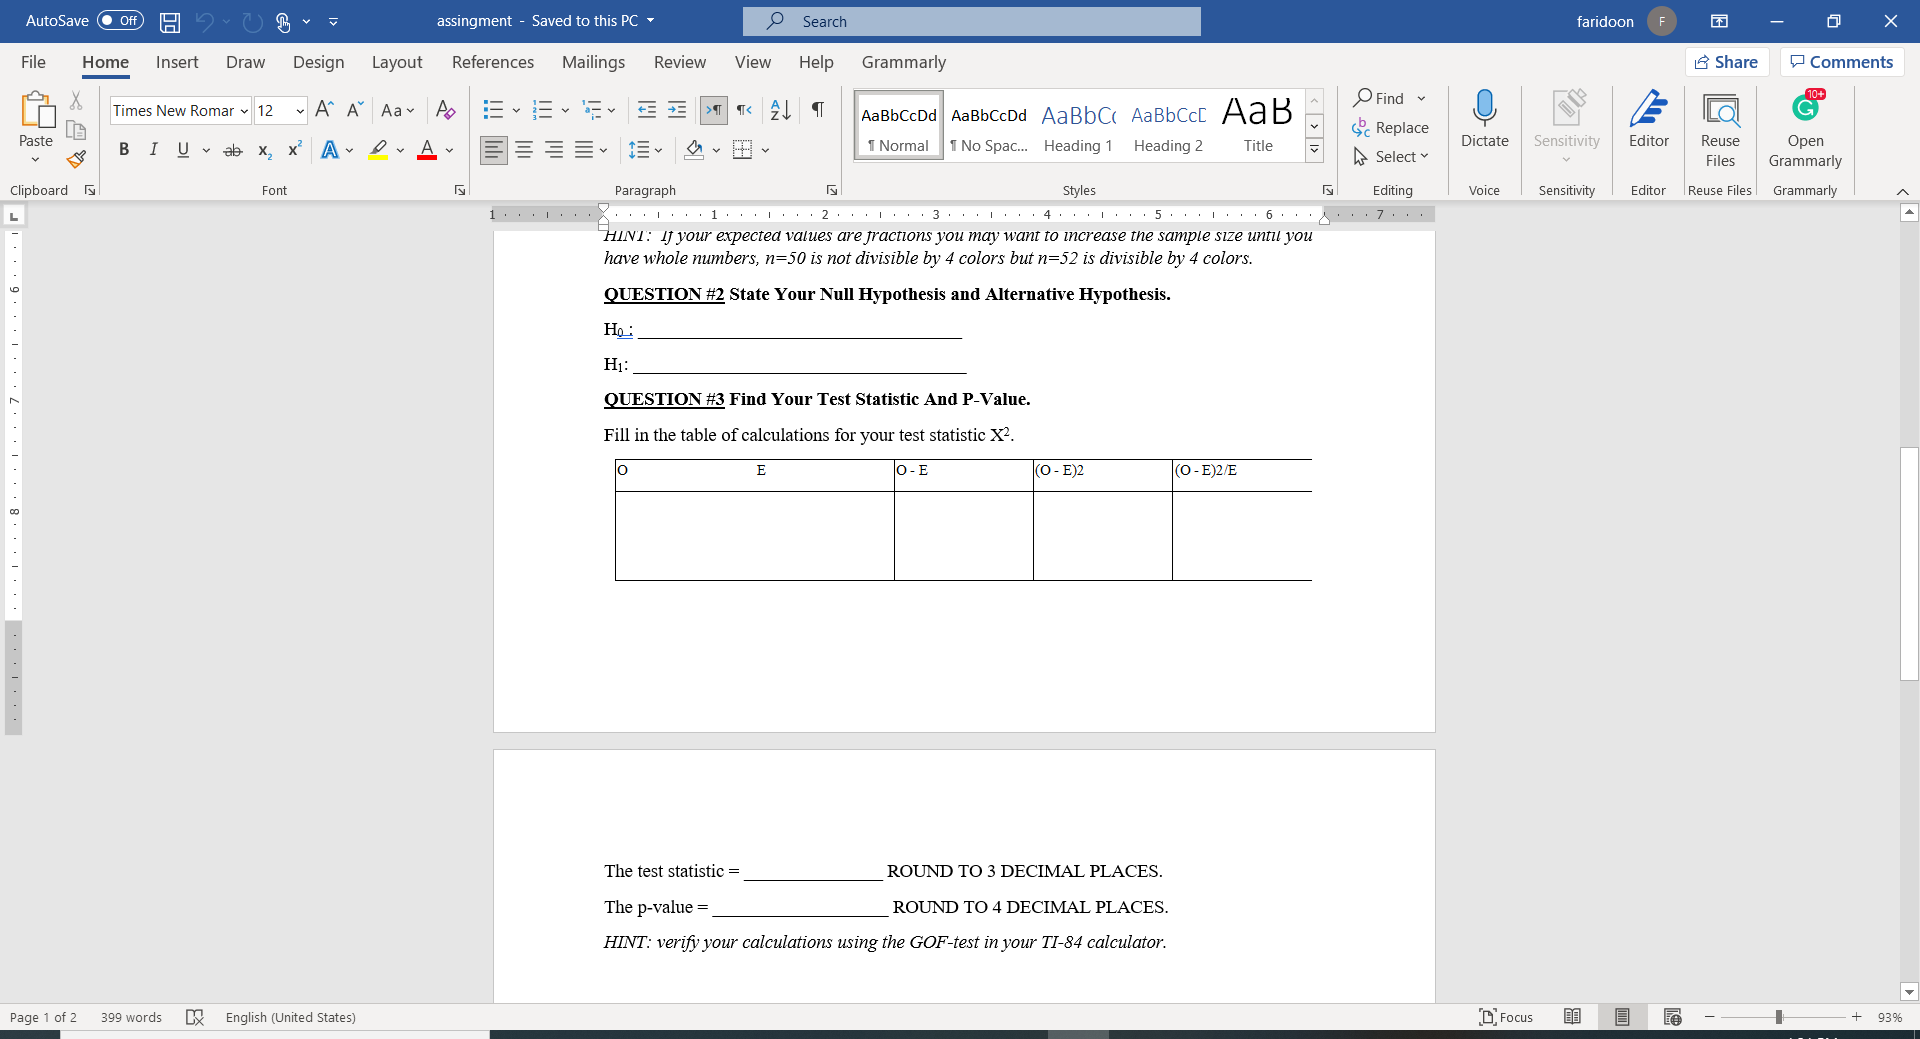
AutoSave . Off) assingment - Saved to this PC Search faridoon F X File Home Insert Draw Design L Layout References Mailings Review View Help Grammarly Share Comments Times New Romar ~ 12 ~ A" A Aa A AaBbCcDd AaBbCcDd AaBbCc AaBbCct AaB Find c Replace Paste BIUvab X x A LA . 1 Normal 1 No Spac... Heading 1 Heading 2 Title Dictate Sensitivity Editor Reuse Open Select Files Grammarly Clipboard IS Font Paragraph Styles Editing Voice Sensitivity Editor Reuse Files Grammarly 1 . . . I . . . 1 . . . 1 . . . I . . .2 . . .I . .. 1 . . . 5 . . . 1 . . .6 . . Are candy color pieces uniformly distributed? In a 2-ounce bag of Skittles, there are green, red, yellow, orange and purple pieces. Ideally, each bag should have the same amount of pieces for each color so that the colors/categories are equally likely. Here's what you need to do, pick (or Google a picture of) a bag of candy (Skittles, M&Ms or Mike & Ikes, etc) that fulfills the requirements listed below and perform a goodness of fit test for uniform distribution using a 0.05 significance level. Fill in the answers from your goodness of fit test into this assignment. Requirements:| O . The sample must contain at least 50 whole pieces Each sample must contain 4 to 7 categories (red, yellow, blue...) QUESTION #1 State Your Claim with Observed/Expected Values Table (5 points): In one or two sentences, state the claim for your goodness of fit test. For example, "My bag of skittles has 50 whole pieces: 12 blue, 18 red ... Using a 0.05 significance level I will test the claim that the candy colors are uniformly distributed (or not uniformly distributed, it's your choice depending on your data set). " Create a table of your observed values and expected values similar to the table below (the number of columns needed depends on your data set): BLUE GREEN YELLOW ... OBSERVED ? VALUES ? ? EXPECTED VALUES ? ? HINT: If your expected values are fractions you may want to increase the sample size until you have whole numbers, n=50 is not divisible by 4 colors but n=52 is divisible by 4 colors. Page 1 of 2 399 words BX English (United States) " Focus - - + 93%AutoSave . Off) assingment - Saved to this PC Search faridoon F X File Home Insert Draw Design L Layout References Mailings Review View Help Grammarly Share Comments Times New Romar ~ 12 ~ A" A Aa A AaBbCcDd AaBbCcDd AaBbC( AaBbCct Aa B Find c Replace Paste BIUab X x A LA 1 Normal 1 No Spac... Heading 1 Heading 2 Title Dictate Sensitivity Editor Reuse Open Select Files Grammarly Clipboard IS Font Paragraph Styles Editing Voice Sensitivity Editor Reuse Files Grammarly 1 . . . I . . . . . 1 . . . I . . . 2 . . . 1 . . . 3 . . . 1 . . . . 5 . . . 1 . . .6 . . . . . .7 HINT: If your expected values are fractions you may want to increase the sample size until you have whole numbers, n=50 is not divisible by 4 colors but n=32 is divisible by 4 colors. QUESTION #2 State Your Null Hypothesis and Alternative Hypothesis. Ho : H1: QUESTION #3 Find Your Test Statistic And P-Value. Fill in the table of calculations for your test statistic X2. E O-E O - E) O-E)2/E The test statistic = ROUND TO 3 DECIMAL PLACES. The p-value = ROUND TO 4 DECIMAL PLACES. HINT: verify your calculations using the GOF-test in your TI-84 calculator. Page 1 of 2 399 words BX English (United States) Focus - - + 93%AutoSave . Off) assingment - Saved to this PC Search faridoon F X File Home Insert Draw Design L Layout References Mailings Review View Help Grammarly Share Comments Times New Romar ~ 12 ~ A" A Aa A AaBbCcDd AaBbCcDd AaBbC( AaBbCct AaB Find c Replace Paste BIUvab X X A LA 1 Normal 1 No Spac... Heading 1 Heading 2 Title Dictate Sensitivity Editor Reuse Open Select Files Grammarly Clipboard IS Font Paragraph Styles Editing Voice Sensitivity Editor Reuse Files Grammarly 1 . . . I . .. 1 . . . 1 . . . I . . .2 . . 1 . . . 5 . . . 1 . . . 6 . . . . . 7 QUESTION #4 Make Your Decision and State Conclusion. Compare your p-value to your significance level using symbols. Make a decision about your claim, for example "since my p-value is less than my sign- level, I will Reject Ho." Based on your decision state the appropriate conclusion, for example "there is (or is not) sufficient..." According to your sample data and your hypothesis test, are your candy colors somewhat uniformly distributed? (yes or no). Page 2 of 2 399 words BX English (United States) Focus - - + 93%