Hello! Can someone PLEASE help me with this? I posted the question before but no one helped me :")
THE EXCHANGE RATE:
| = '/$ : 118 |
| = /$ / A$/$ :106.31 |
| = A$/$ :1.11 |
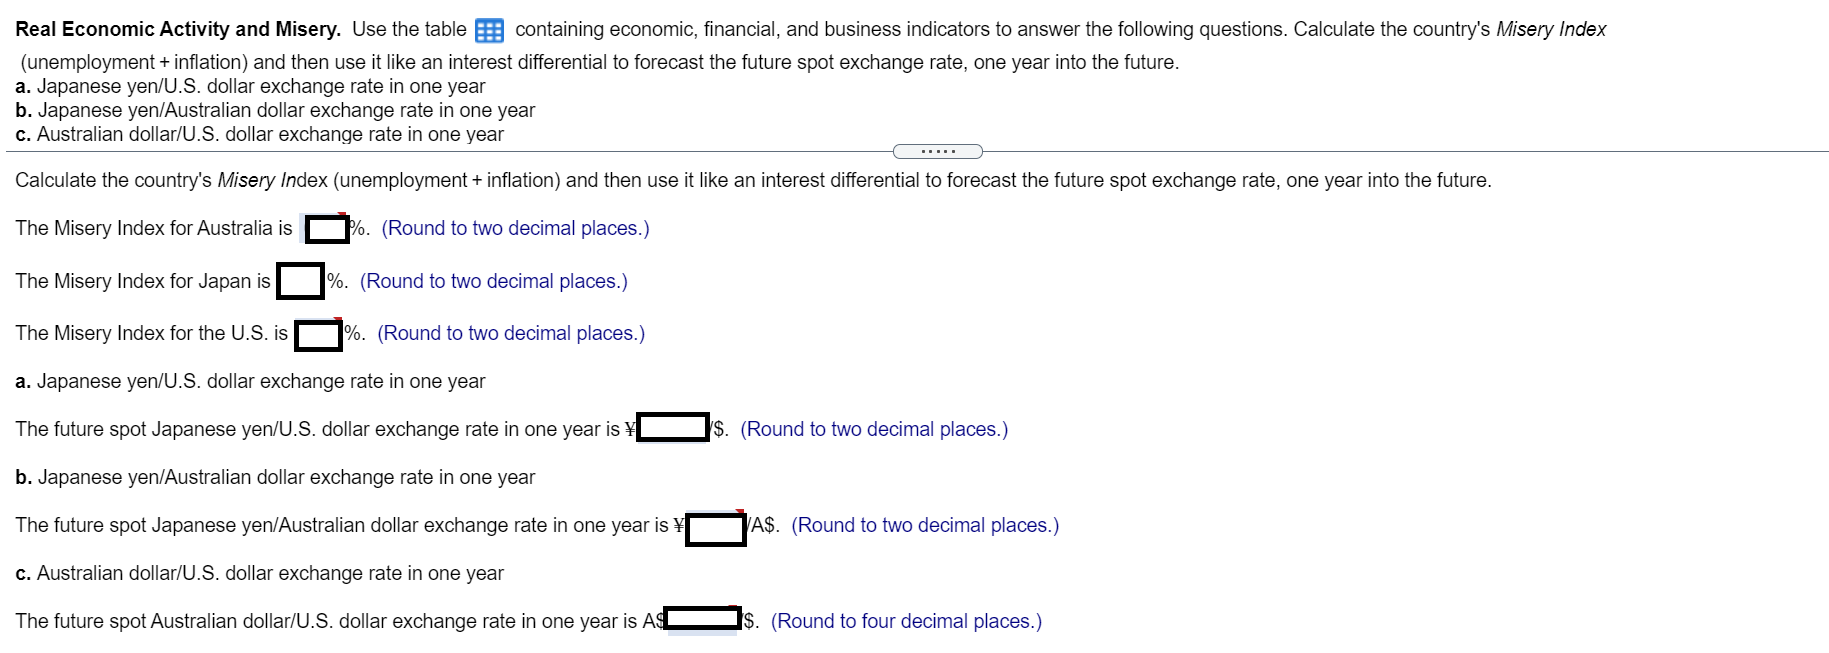
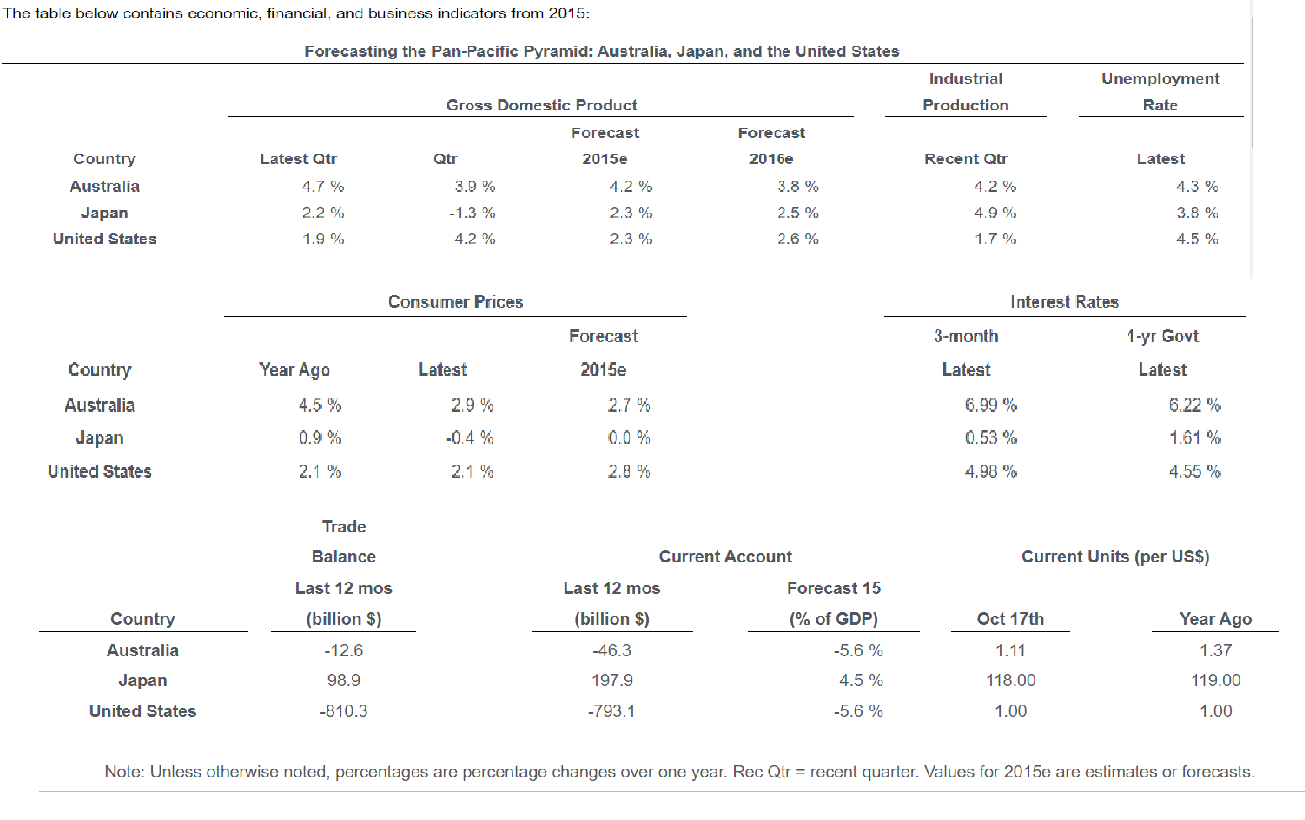
Real Economic Activity and Misery. Use the table containing economic, financial, and business indicators to answer the following questions. Calculate the country's Misery Index (unemployment + inflation) and then use it like an interest differential to forecast the future spot exchange rate, one year into the future. a. Japanese yen/U.S. dollar exchange rate in one year b. Japanese yen/Australian dollar exchange rate in one year c. Australian dollar/U.S. dollar exchange rate in one year Calculate the country's Misery Index (unemployment + inflation) and then use it like an interest differential to forecast the future spot exchange rate, one year into the future. The Misery Index for Australia is P. (Round to two decimal places.) The Misery Index for Japan is %. (Round to two decimal places.) The Misery Index for the U.S.is 1%. (Round to two decimal places.) a. Japanese yen/U.S. dollar exchange rate in one year The future spot Japanese yen/U.S. dollar exchange rate in one year is $. (Round to two decimal places.) b. Japanese yen/Australian dollar exchange rate in one year The future spot Japanese yen/Australian dollar exchange rate in one year is A$. (Round to two decimal places.) c. Australian dollar/U.S. dollar exchange rate in one year The future spot Australian dollar/U.S. dollar exchange rate in one year is A (Round to four decimal places.) The table below contains economic, financial, and business indicators from 2015: Forecasting the Pan-Pacific Pyramid: Australia, Japan, and the United States Industrial Unemployment Rate Gross Domestic Product Production Forecast Forecast Country Latest Qtr Qtr 2015e 2016e Recent Qtr Latest Australia 4.7 % 3.9 % 4.2 % 3.8 % 4.2 % 4.3 % Japan -1.3 % 2.3% 2.5 % 4.9% 2.2 % 1.9 % 3.8 % 4.5 % United States 4.2 % 2.3% 2.6 % 1.7 % Consumer Prices Interest Rates Forecast 3-month 1-yr Govt Latest Country Year Ago Latest 2015e Latest Australia 4.5 % 2.9% 2.7% 6.99% 6.22% 0.9% -0.4% 0.0 % 0.53% 1.61 % Japan United States 2.1 % 2.1 % 2.8 % 4.98 % 4.55% Trade Balance Current Account Current Units (per US$) Last 12 mos (billion $) -12.6 Last 12 mos (billion $) Forecast 15 (% of GDP) Country Australia Oct 17th Year Ago 1.37 46.3 -5.6 % 1.11 98.9 197.9 4.5 % 118.00 119.00 Japan United States -810.3 -793.1 -5.6 % 1.00 1.00 Note: Unless otherwise noted, percentages are percentage changes over one year. Rec Qtr = recent quarter. Values for 2015e are estimates or forecasts. Real Economic Activity and Misery. Use the table containing economic, financial, and business indicators to answer the following questions. Calculate the country's Misery Index (unemployment + inflation) and then use it like an interest differential to forecast the future spot exchange rate, one year into the future. a. Japanese yen/U.S. dollar exchange rate in one year b. Japanese yen/Australian dollar exchange rate in one year c. Australian dollar/U.S. dollar exchange rate in one year Calculate the country's Misery Index (unemployment + inflation) and then use it like an interest differential to forecast the future spot exchange rate, one year into the future. The Misery Index for Australia is P. (Round to two decimal places.) The Misery Index for Japan is %. (Round to two decimal places.) The Misery Index for the U.S.is 1%. (Round to two decimal places.) a. Japanese yen/U.S. dollar exchange rate in one year The future spot Japanese yen/U.S. dollar exchange rate in one year is $. (Round to two decimal places.) b. Japanese yen/Australian dollar exchange rate in one year The future spot Japanese yen/Australian dollar exchange rate in one year is A$. (Round to two decimal places.) c. Australian dollar/U.S. dollar exchange rate in one year The future spot Australian dollar/U.S. dollar exchange rate in one year is A (Round to four decimal places.) The table below contains economic, financial, and business indicators from 2015: Forecasting the Pan-Pacific Pyramid: Australia, Japan, and the United States Industrial Unemployment Rate Gross Domestic Product Production Forecast Forecast Country Latest Qtr Qtr 2015e 2016e Recent Qtr Latest Australia 4.7 % 3.9 % 4.2 % 3.8 % 4.2 % 4.3 % Japan -1.3 % 2.3% 2.5 % 4.9% 2.2 % 1.9 % 3.8 % 4.5 % United States 4.2 % 2.3% 2.6 % 1.7 % Consumer Prices Interest Rates Forecast 3-month 1-yr Govt Latest Country Year Ago Latest 2015e Latest Australia 4.5 % 2.9% 2.7% 6.99% 6.22% 0.9% -0.4% 0.0 % 0.53% 1.61 % Japan United States 2.1 % 2.1 % 2.8 % 4.98 % 4.55% Trade Balance Current Account Current Units (per US$) Last 12 mos (billion $) -12.6 Last 12 mos (billion $) Forecast 15 (% of GDP) Country Australia Oct 17th Year Ago 1.37 46.3 -5.6 % 1.11 98.9 197.9 4.5 % 118.00 119.00 Japan United States -810.3 -793.1 -5.6 % 1.00 1.00 Note: Unless otherwise noted, percentages are percentage changes over one year. Rec Qtr = recent quarter. Values for 2015e are estimates or forecasts