
Hello can someone please help with this problem? Thank you
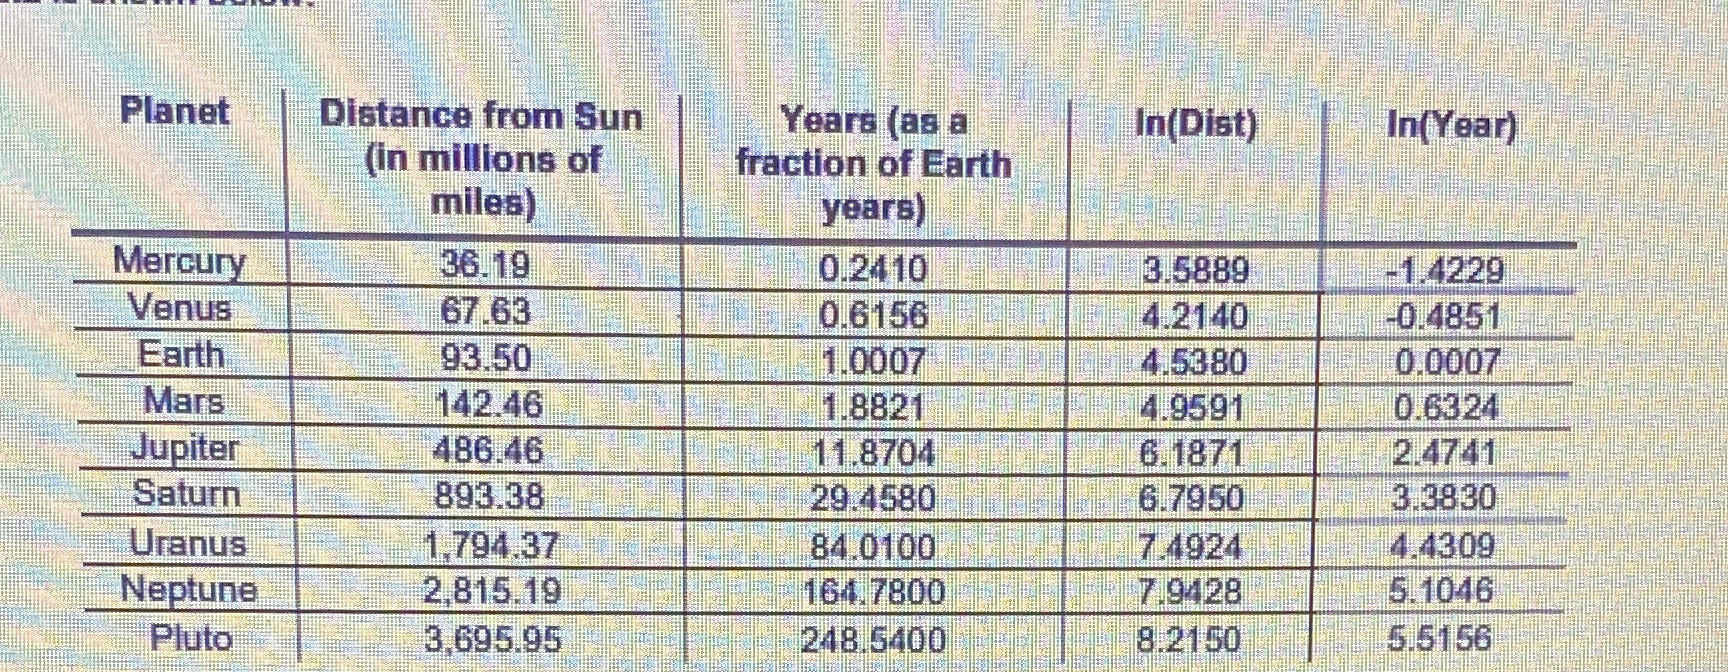
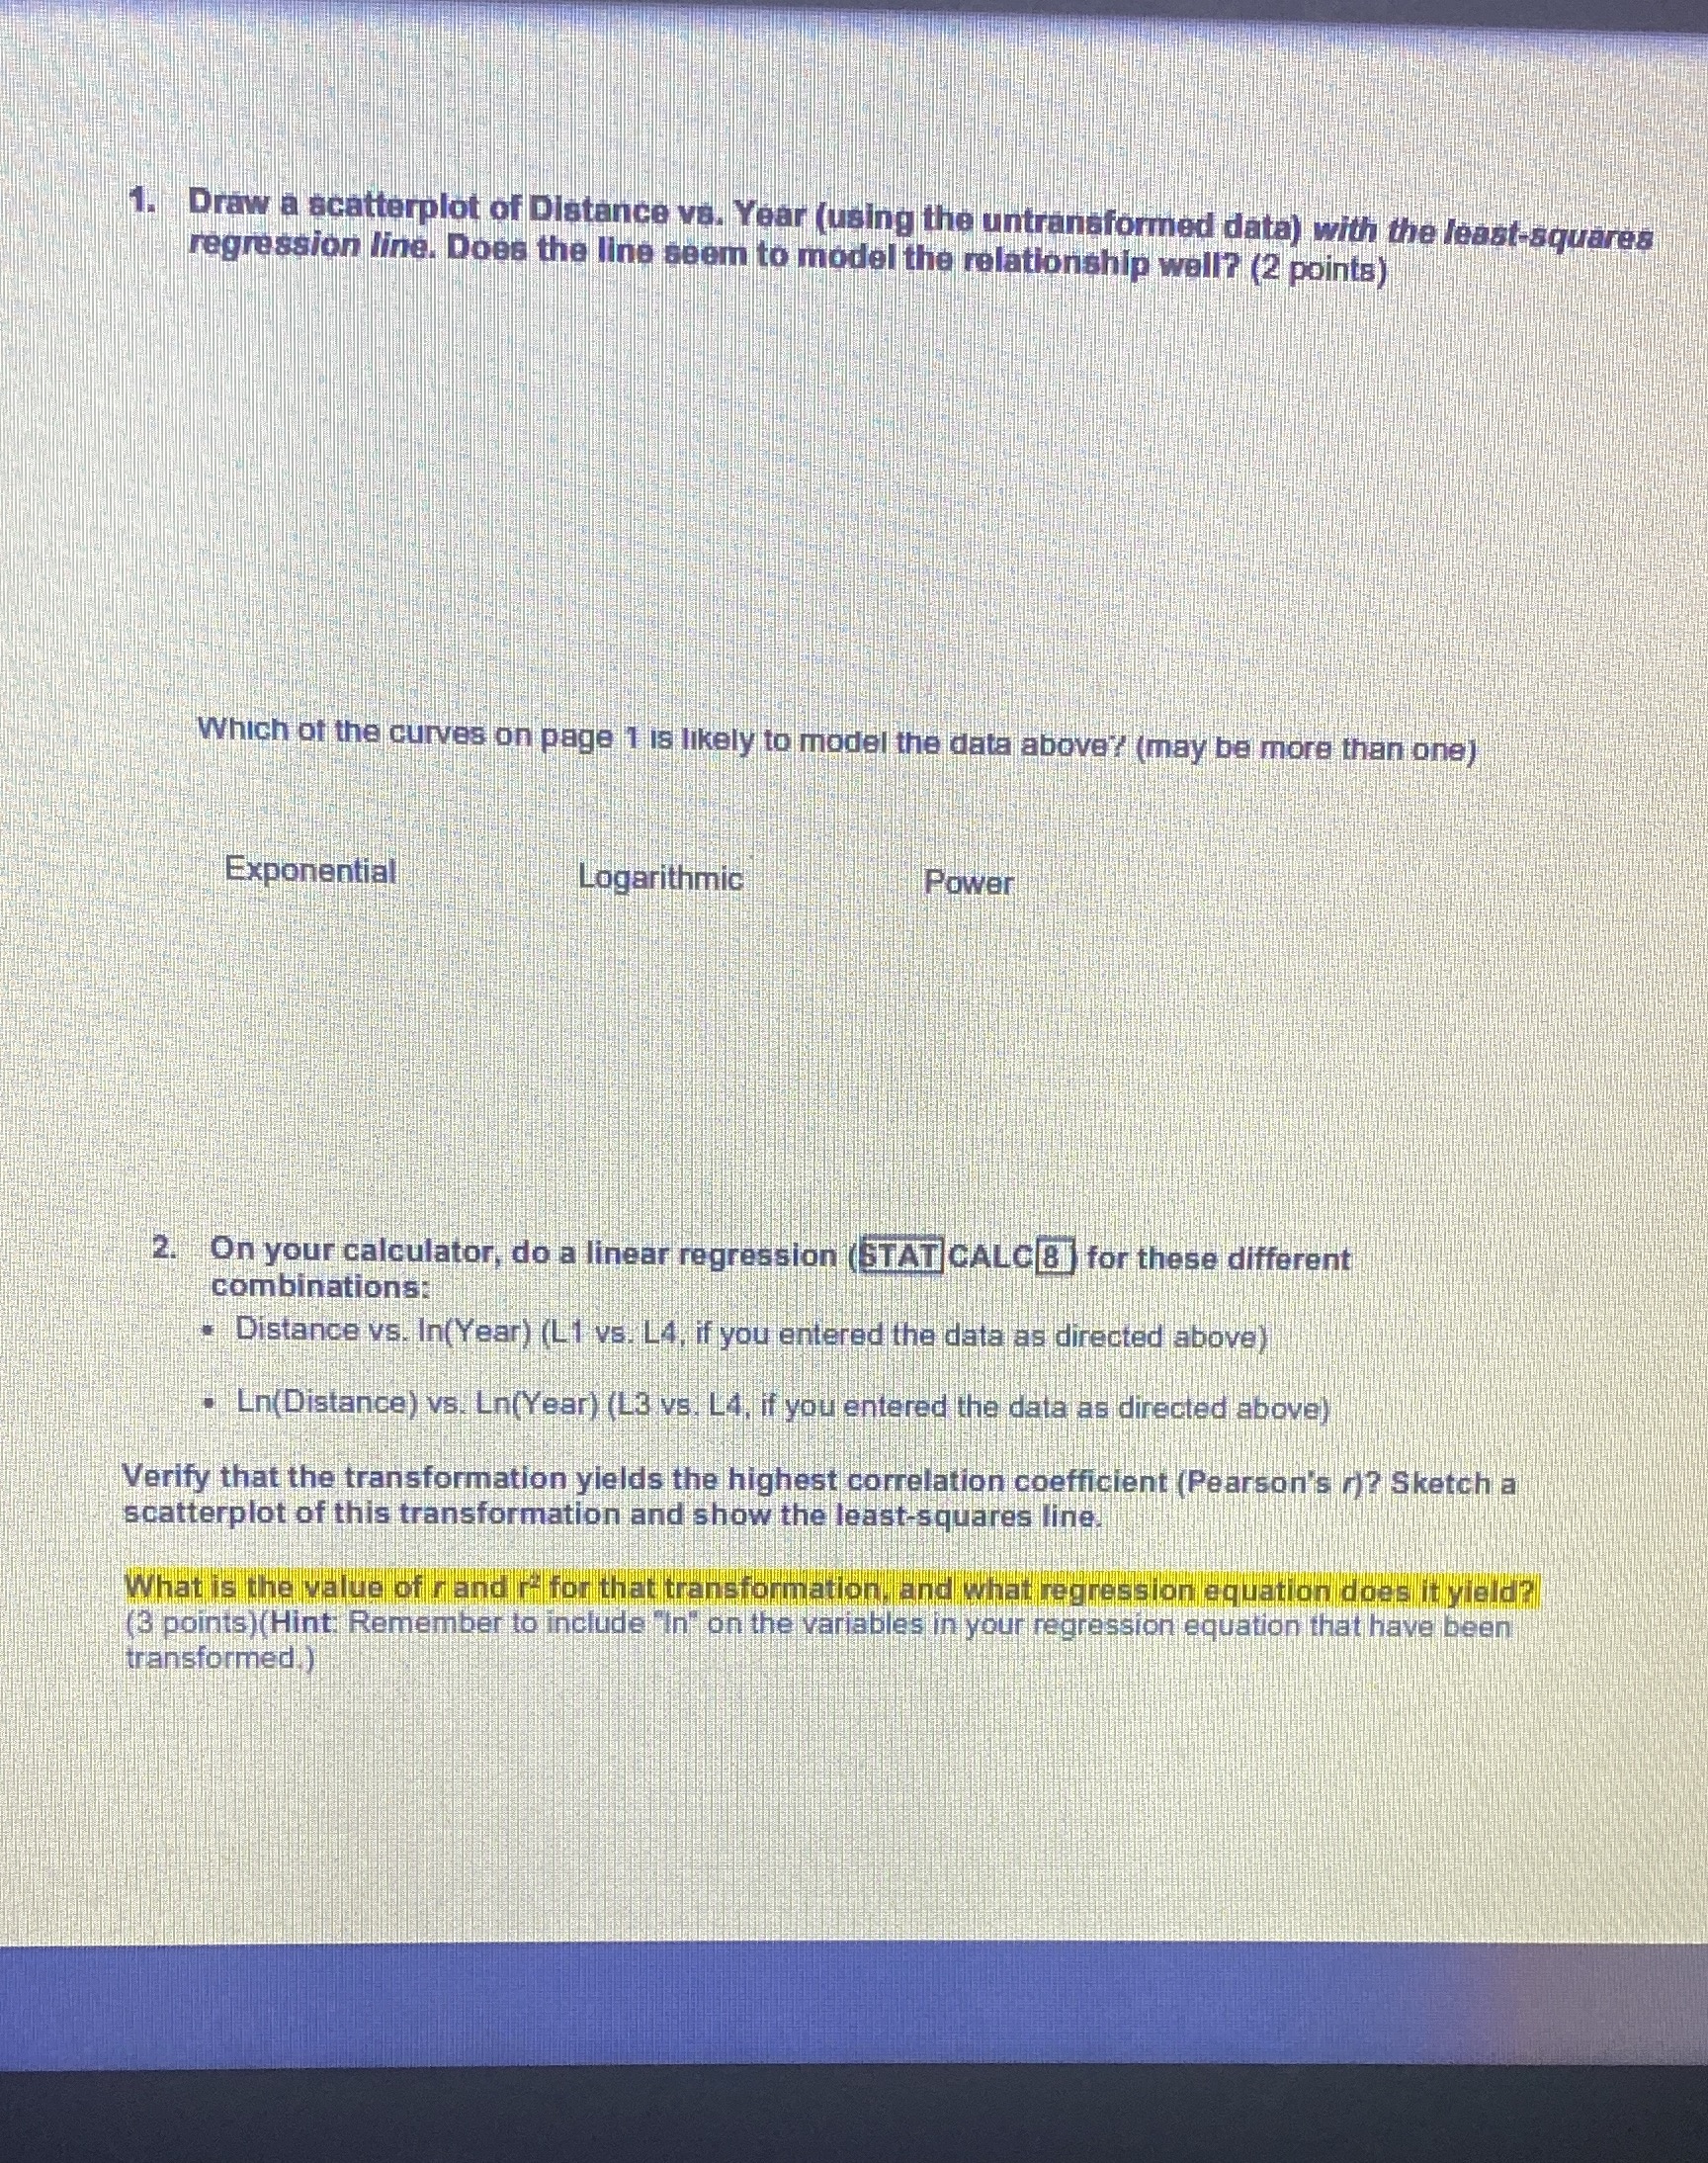
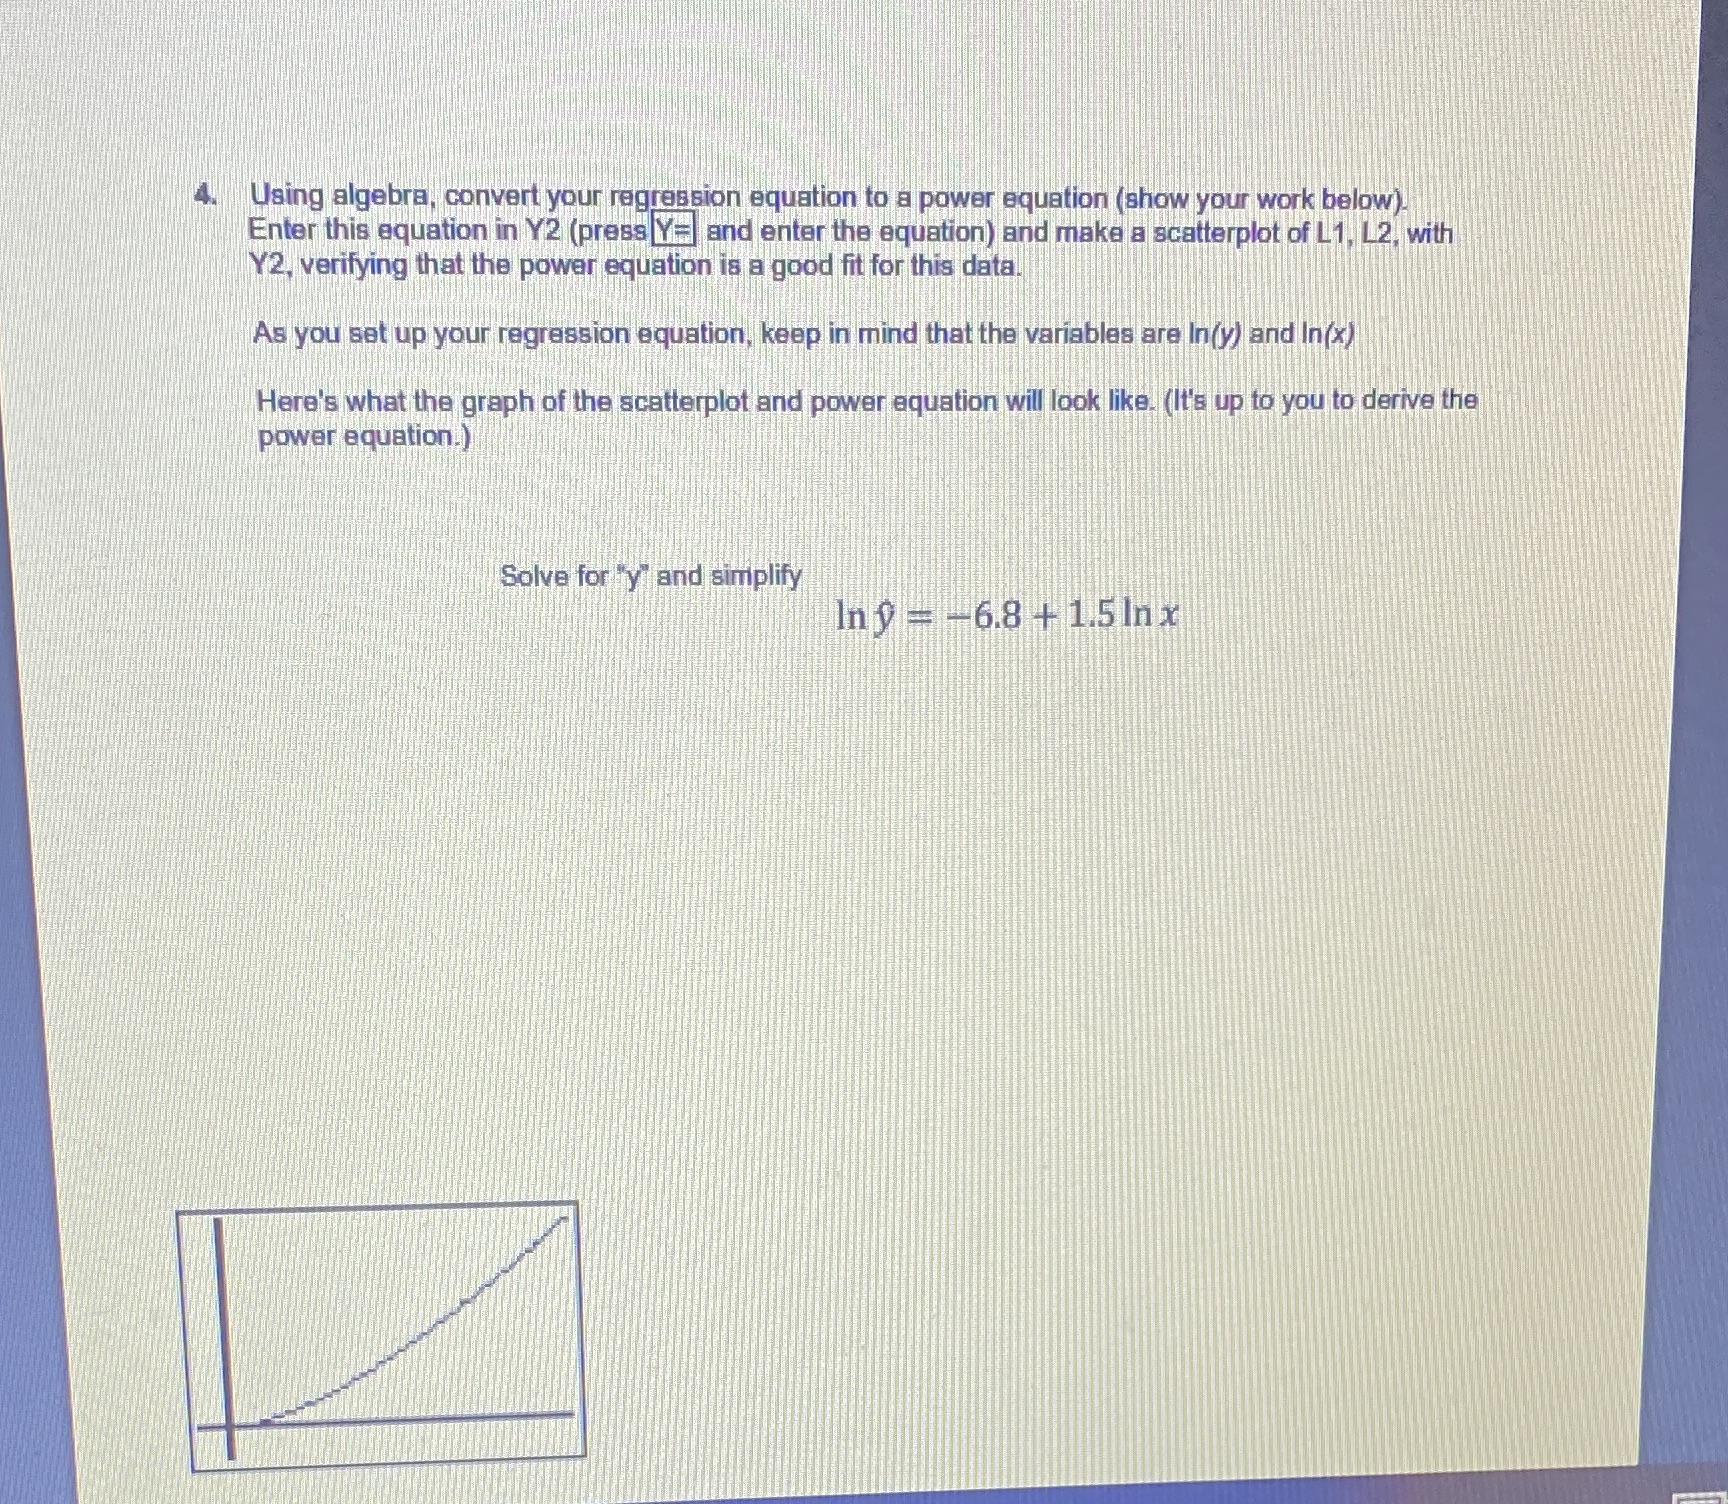
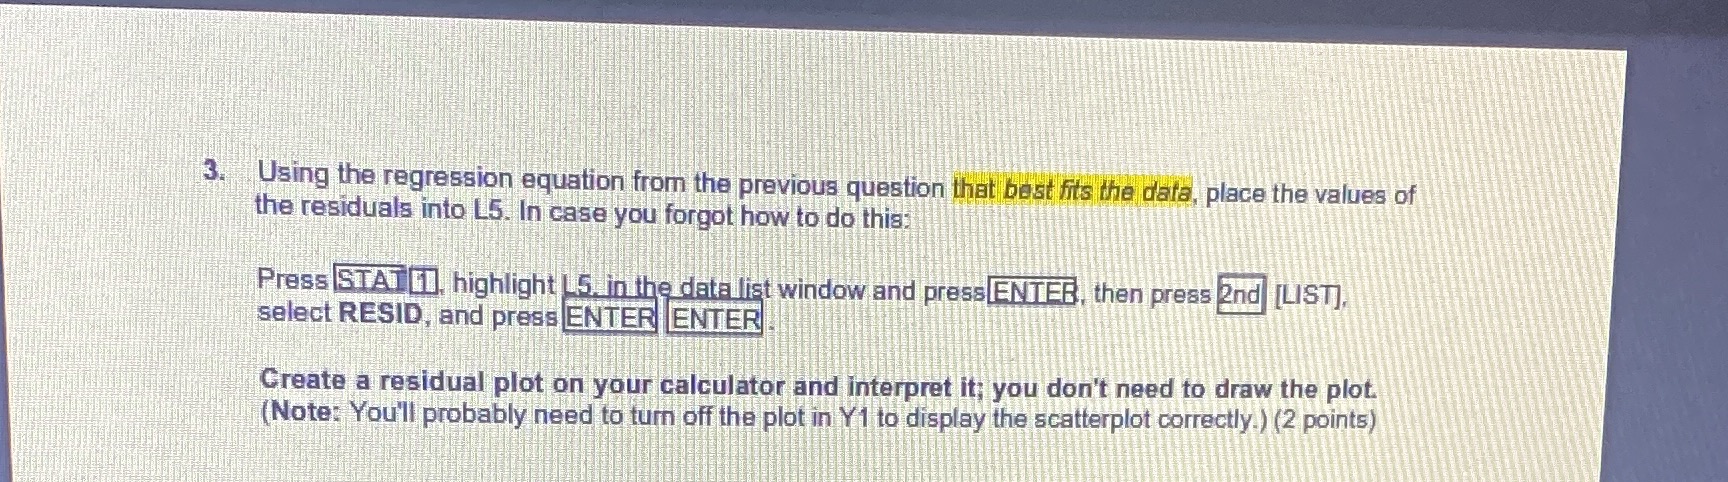
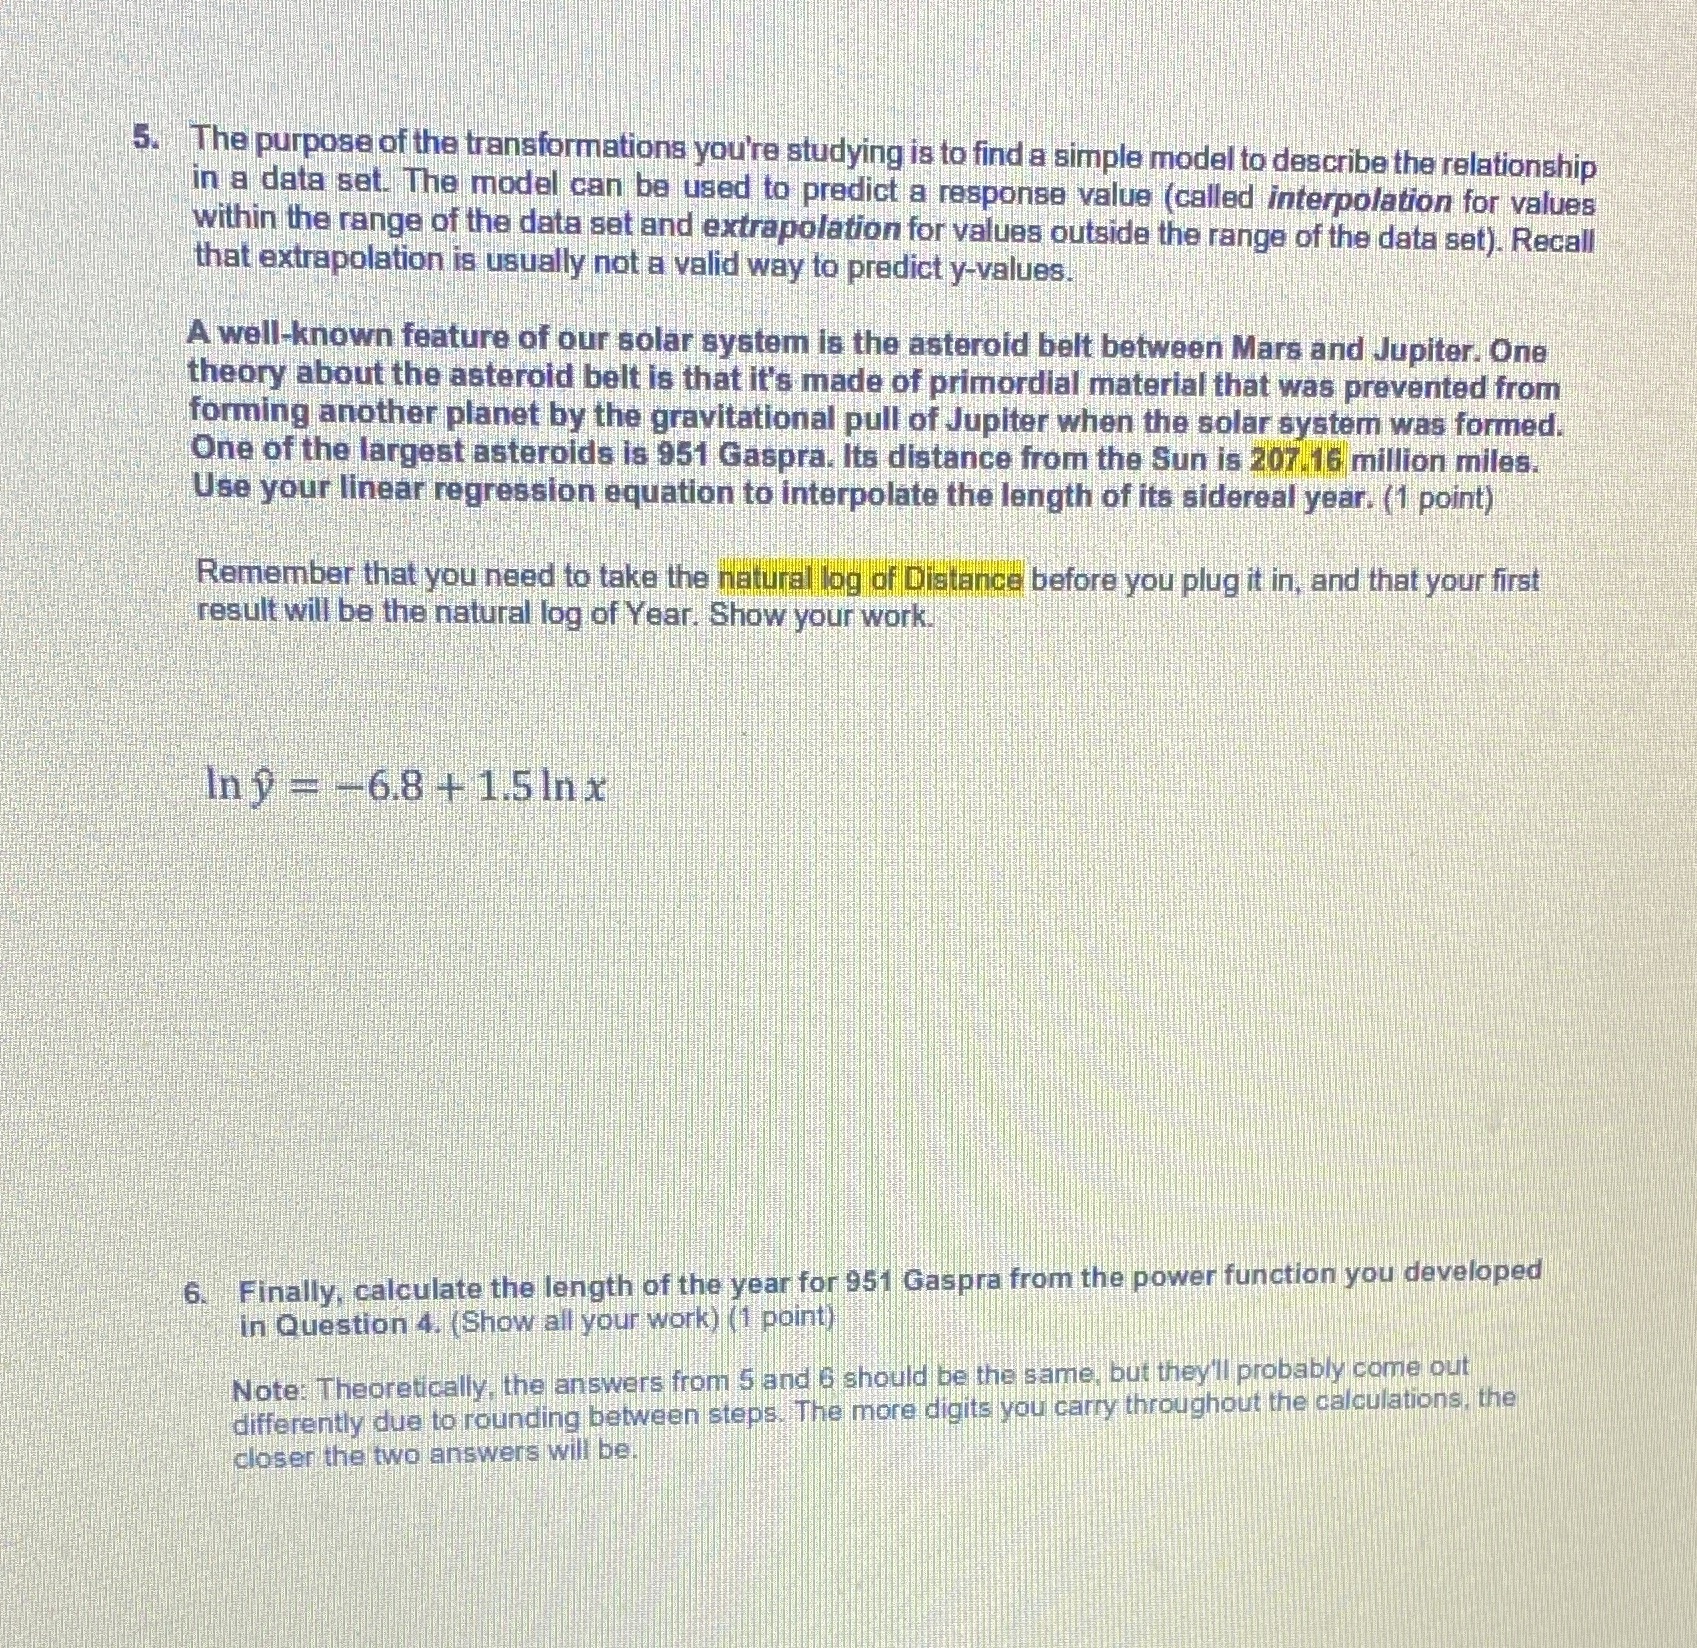
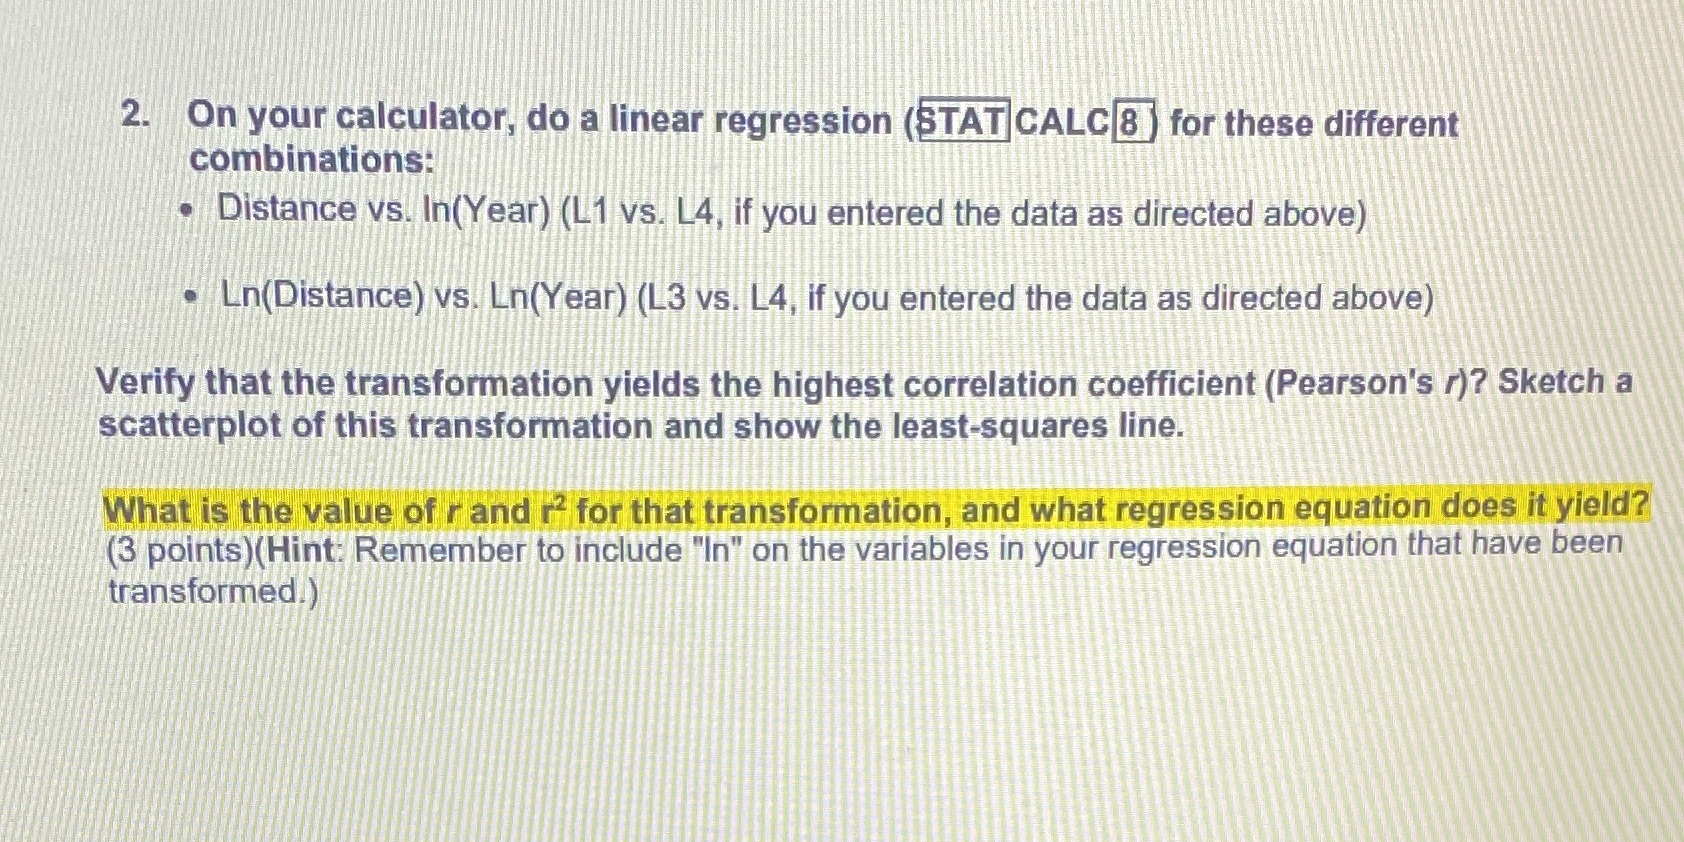
Planet Distance from Sun Years (as a In(Dist) In(Year) (in millions of fraction of Earth miles) years) Mercury 36.19 0.2410 3.5889 1.4229 Venus 67.63 0.6156 1.2140 0.4851 Earth 93.50 1.0007 1.5380 0.0007 Mars 142.46 1.8821 4.9591 0.6324 Jupiter 486.46 11.8704 6.187 2.4741 Saturn 893.38 29.4580 6.7950 3.3830 Uranus 1,794.37 84.0100 7.4924 4.4309 Neptune 2.815.19 164.7800 7.9428 5.1046 Pluto 3.695.95 248.5400 8.2150 5.51561. Draw a scatterplot of Distance va. Year (using the untransformed data) with the least-squares regression line. Does the line seem to model the relationship well? (2 points Which of the curves on page 1 is likely to model the data above? (may be more than one) Exponential Logarithmic Power 2. On your calculator, do a linear regression (STAT CALC 8 ) for these different combinations: Distance vs. In(Year) (L1 vs. L4, if you entered the data as directed above) - Ln(Distance) vs. Ln(Year) (L3 vs. L4, if you entered the data as directed above) Verify that the transformation yields the highest correlation coefficient (Pearson's /)? Sketch a scatterplot of this transformation and show the least-squares line. What is the value of r and r for that transformation, and what regression equation does it yield? (3 points)(Hint: Remember to include in) on the variables in your regression equation that have been transformed.)3. Using the regression equation from the previous question that best fits the data, place the values of the residuals into L5. In case you forgot how to do this: Press STAT 1), highlight LS. in the data list window and press ENTER, then press 2nd [LIST], select RESID and press ENTER ENTER Create a residual plot on your calculator and interpret it; you don't need to draw the plot. (Note: You'll probably need to turn off the plot in Y1 to display the scatterplot correctly.) (2 points)4. Using algebra, convert your regression equation to a power equation (show your work below). Enter this equation in Y2 (press Y=] and enter the equation) and make a scatterplot of L1, L2, with Y2, verifying that the power equation is a good fit for this data. As you set up your regression equation, keep in mind that the variables are In(y) and In(x) Here's what the graph of the scatterplot and power equation will look like. (It's up to you to derive the power equation.) Solve for "y and simplify In 9 = -6.8 + 1.5 Inx. The purpose of the transformations you're studying is to find a simple model to describe the relationship in a data set. The model can be used to predict a response value (called interpolation for values within the range of the data set and extrapolation for values outside the range of the data set). Recall that extrapolation is usually not a valid way to predict y-values. A well-known feature of our solar system is the asteroid belt between Mars and Jupiter. One theory about the asteroid belt is that it's made of primordial material that was prevented from forming another planet by the gravitational pull of Jupiter when the solar system was formed. One of the largest asteroids is 951 Gaspra. Its distance from the Sun is 207.16 million miles. Use your linear regression equation to interpolate the length of its sidereal year. (1 point) Remember that you need to take the natural log of Distance before you plug it in, and that your first result will be the natural log of Year. Show your work. In 9 = -6.8 + 1.5 In x 5. Finally, calculate the length of the year for 951 Gaspra from the power function you developed in Question 4. (Show all your work) (1 point) Note: Theoretically, the answers from 5 and s should be the same, but they'll probably come out differently due to rounding between steps. The more digits you carry throughout the calculations, the closer the two answers will be.2. On your calculator, do a linear regression (STAT CALC 8 ) for these different combinations: . Distance vs. In(Year) (L1 vs. L4, if you entered the data as directed above) . Ln(Distance) vs. Ln(Year) (L3 vs. L4, if you entered the data as directed above) Verify that the transformation yields the highest correlation coefficient (Pearson's r)? Sketch a scatterplot of this transformation and show the least-squares line. What is the value of r and r? for that transformation, and what regression equation does it yield? (3 points)(Hint: Remember to include "In" on the variables in your regression equation that have been transformed.)