

Answered step by step
Verified Expert Solution
Question
1 Approved Answer
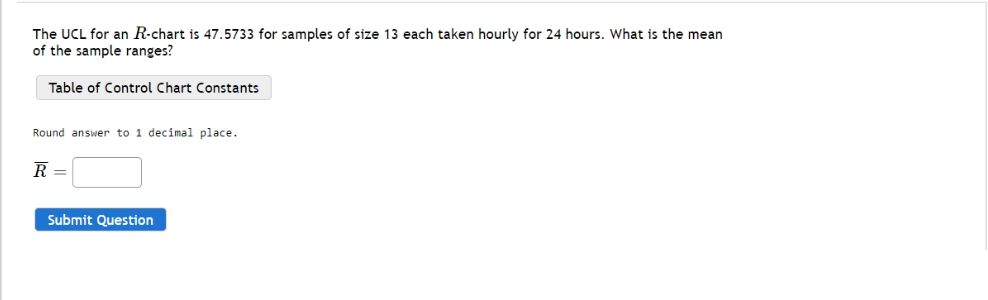
Hello, Can you help me solve these questions? I need you to do all the questions if possible. Question 1 The UCL for an R-chart
Hello, Can you help me solve these questions? I need you to do all the questions if possible.
Question 1
Step by Step Solution
There are 3 Steps involved in it
Step: 1

Get Instant Access to Expert-Tailored Solutions
See step-by-step solutions with expert insights and AI powered tools for academic success
Step: 2

Step: 3
Ace Your Homework with AI
Get the answers you need in no time with our AI-driven, step-by-step assistance
Get Started