Hello can you help me with these questions This is the data Statistics Political Science Psychology Bonferroni (Corrected a) Gender Male 78504.56 62612.78 73313.28 Male
Hello can you help me with these questions
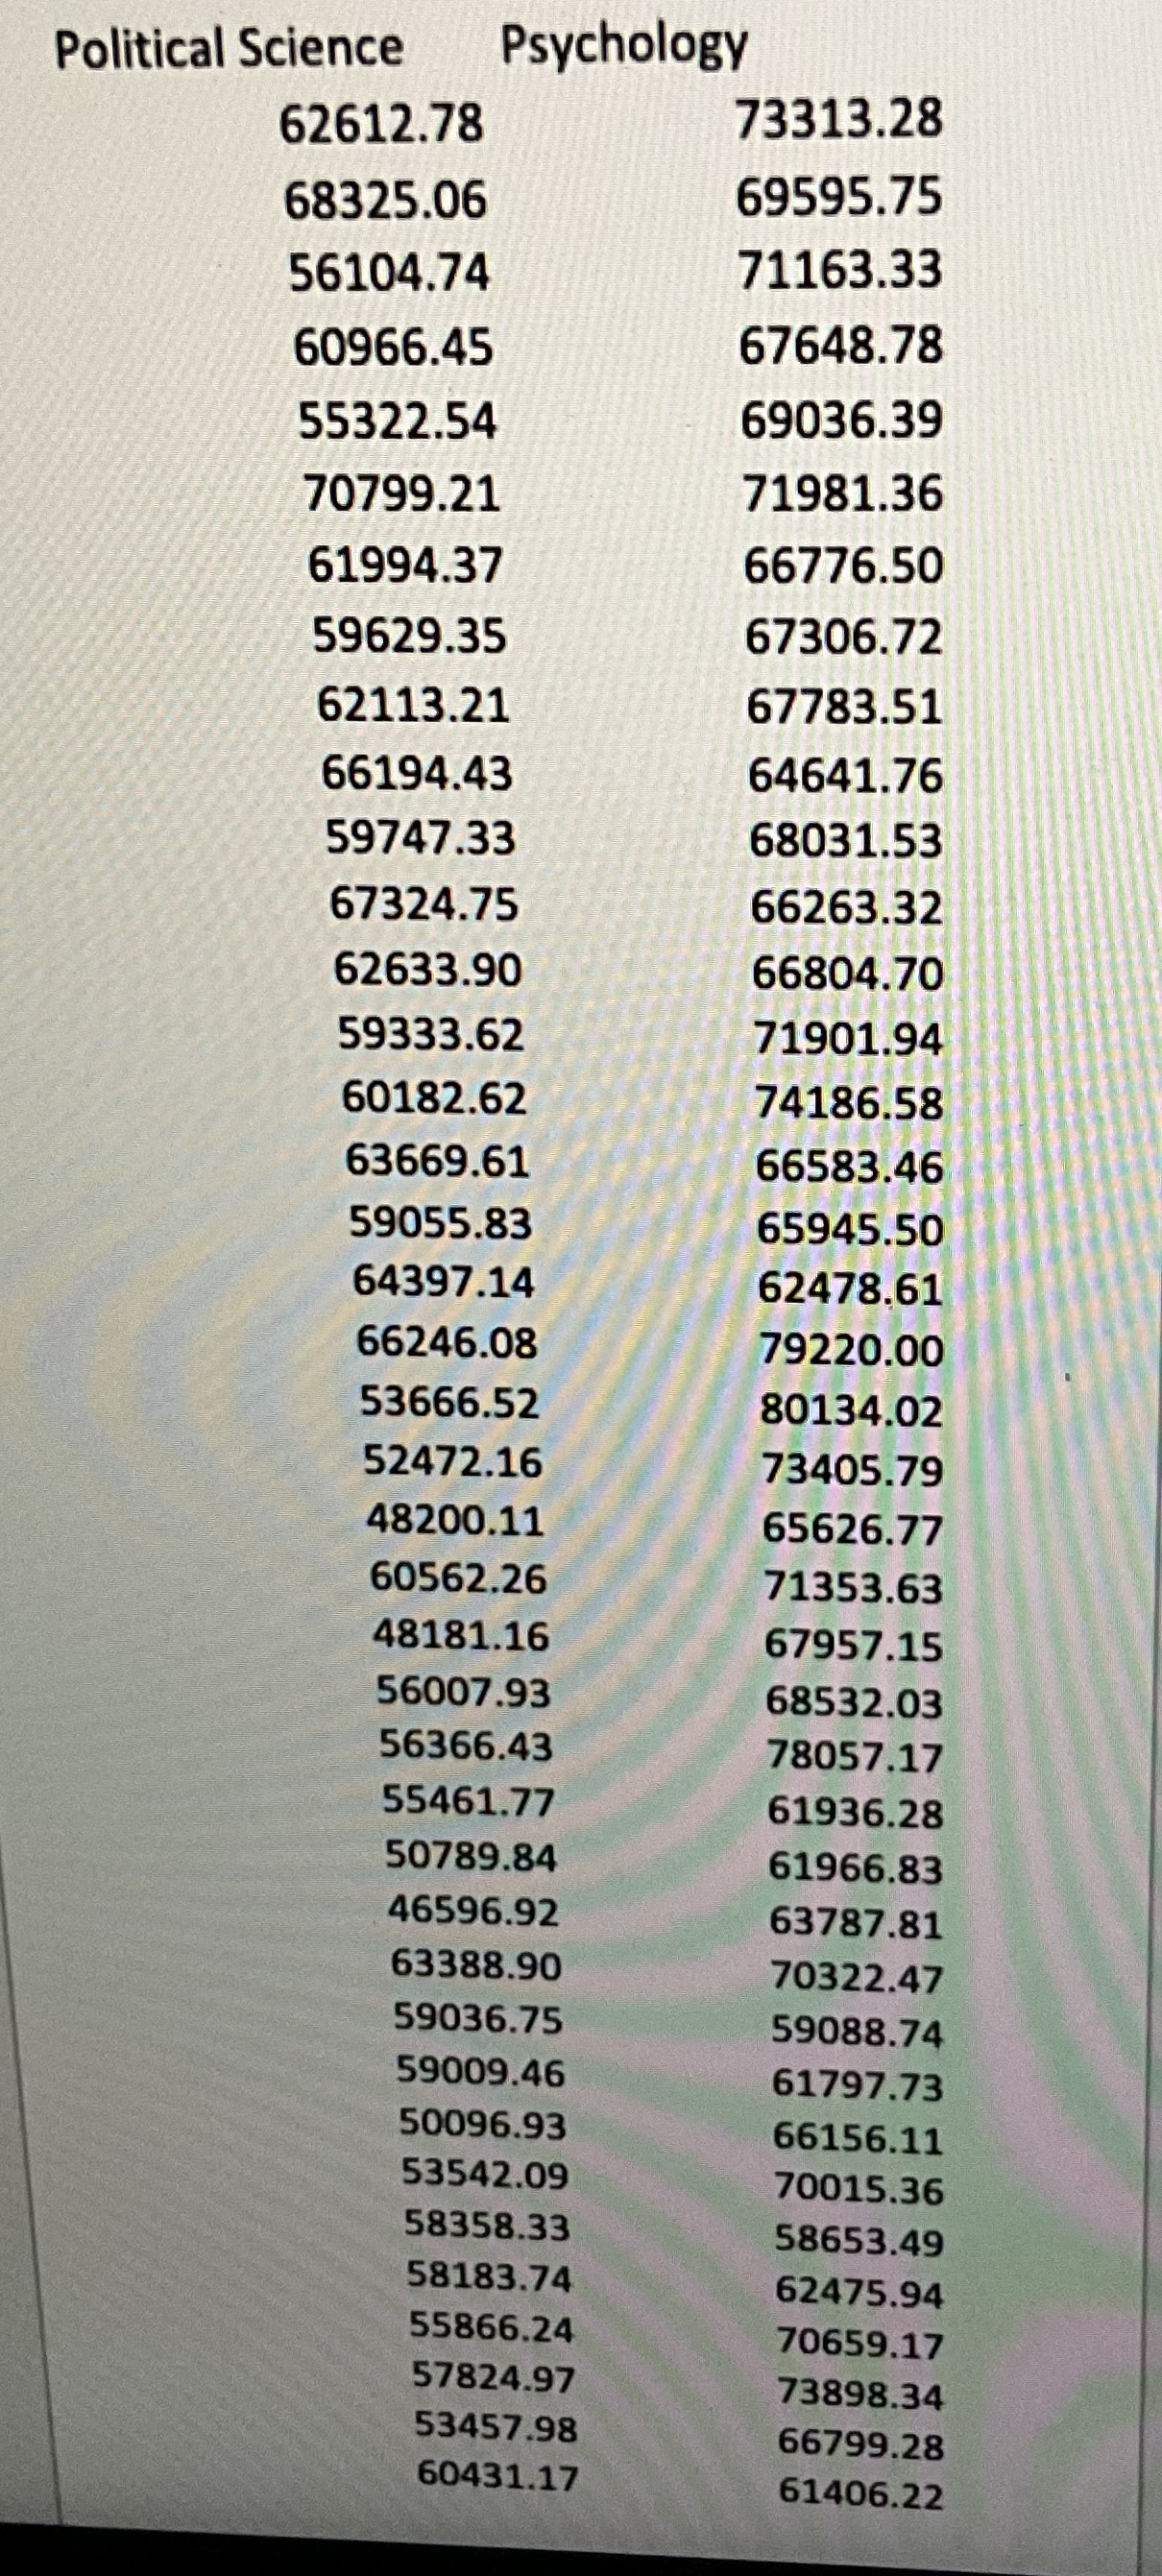
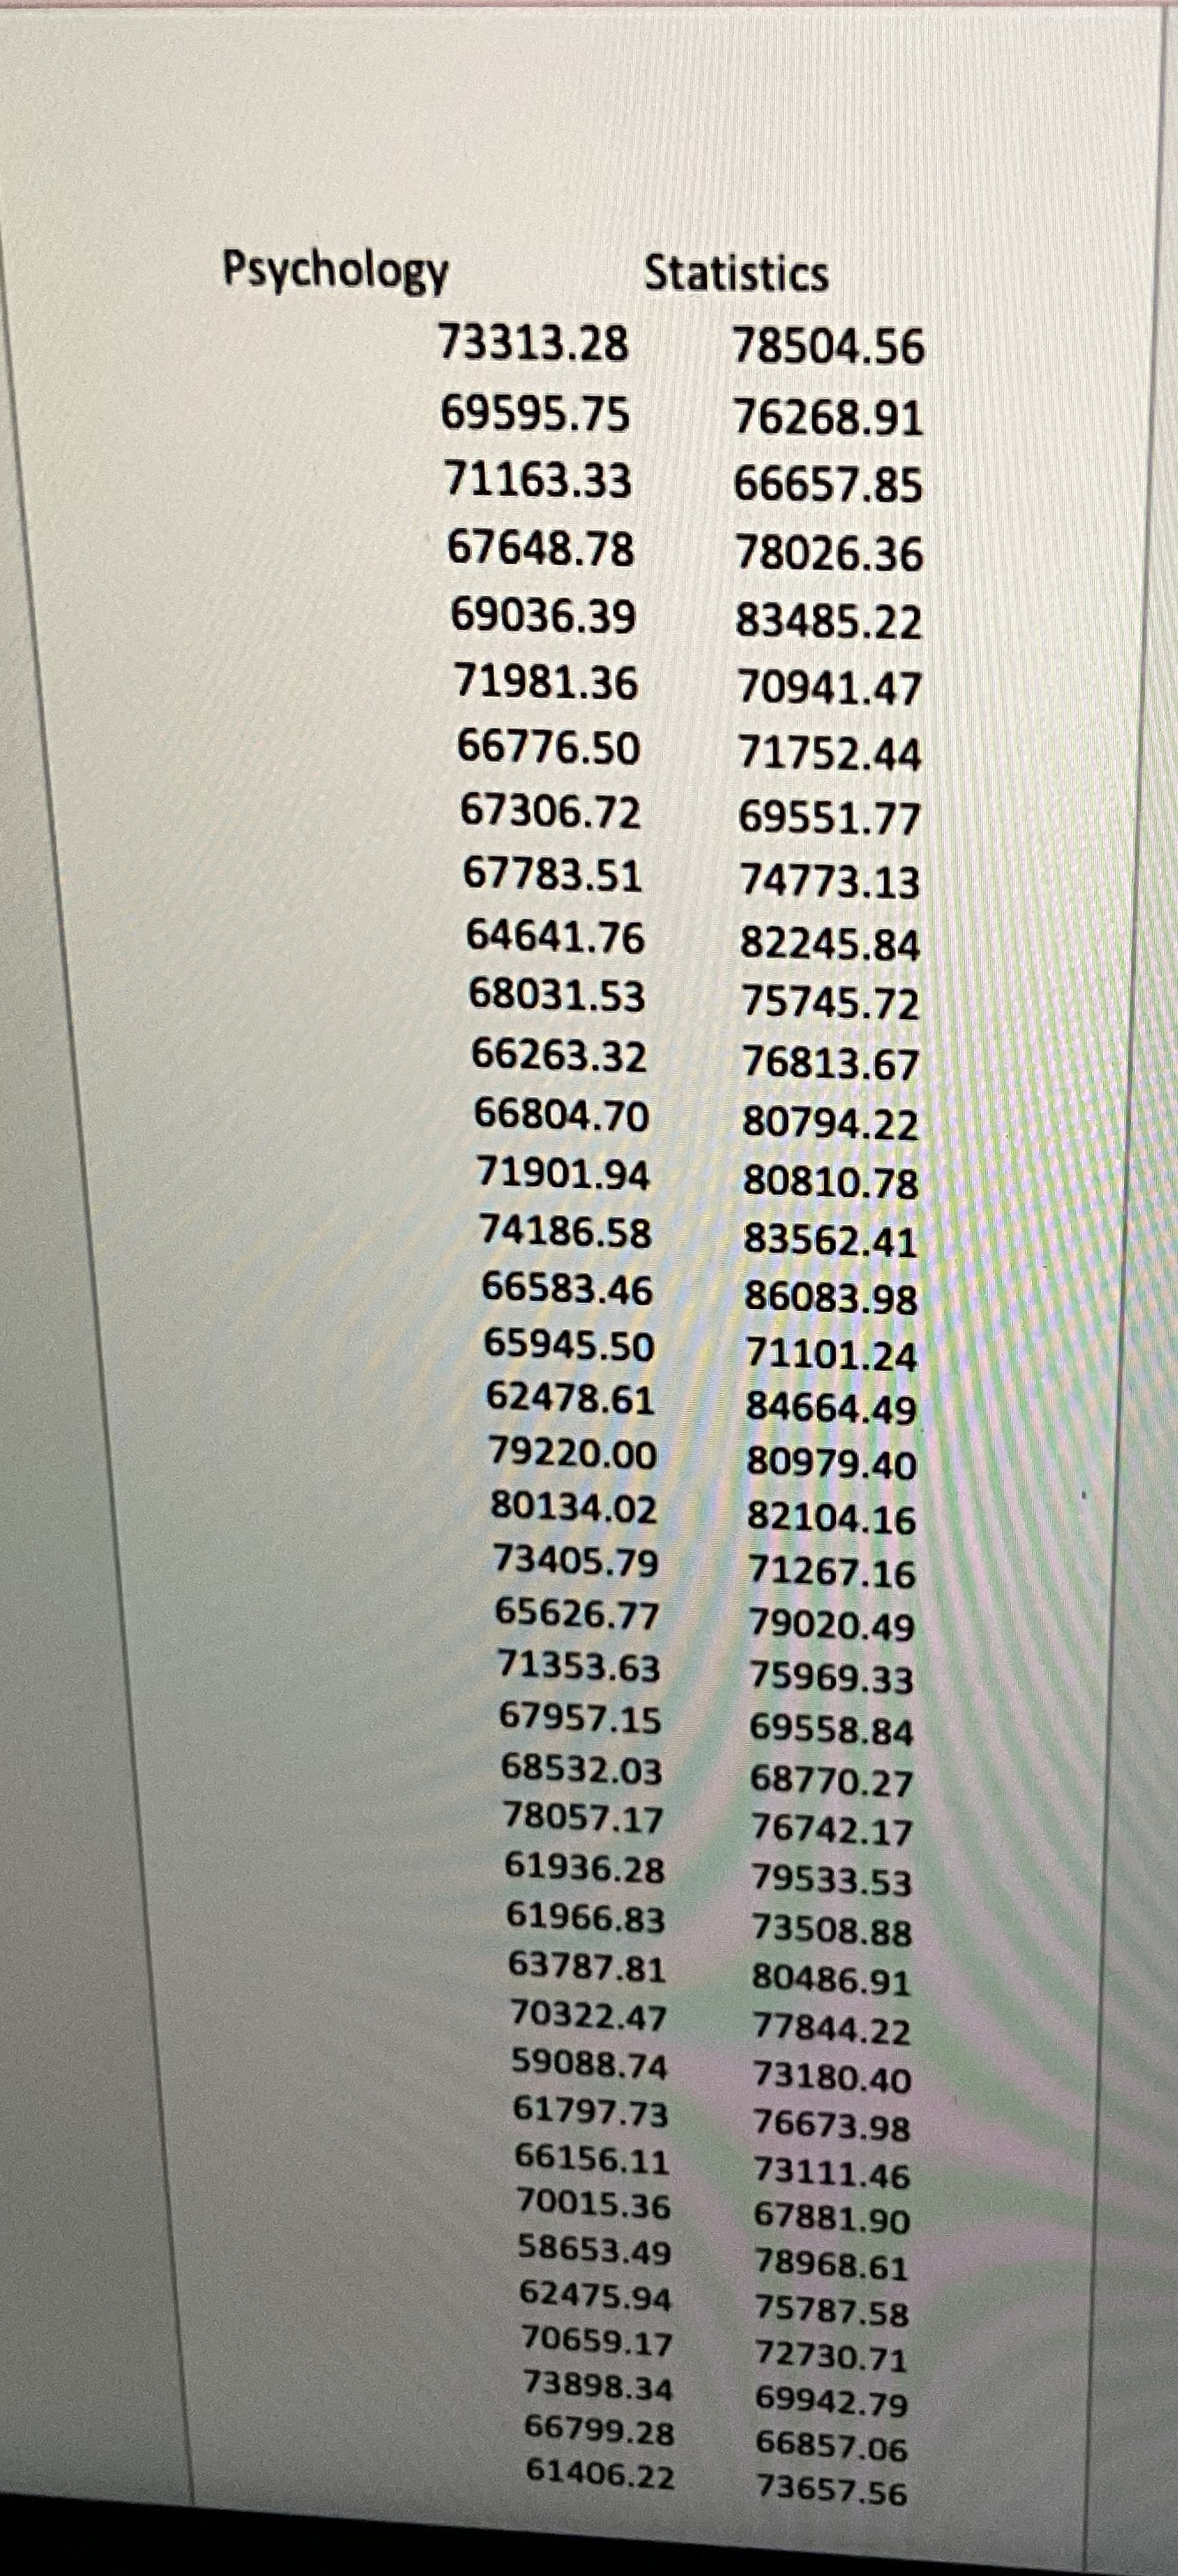
This is the data
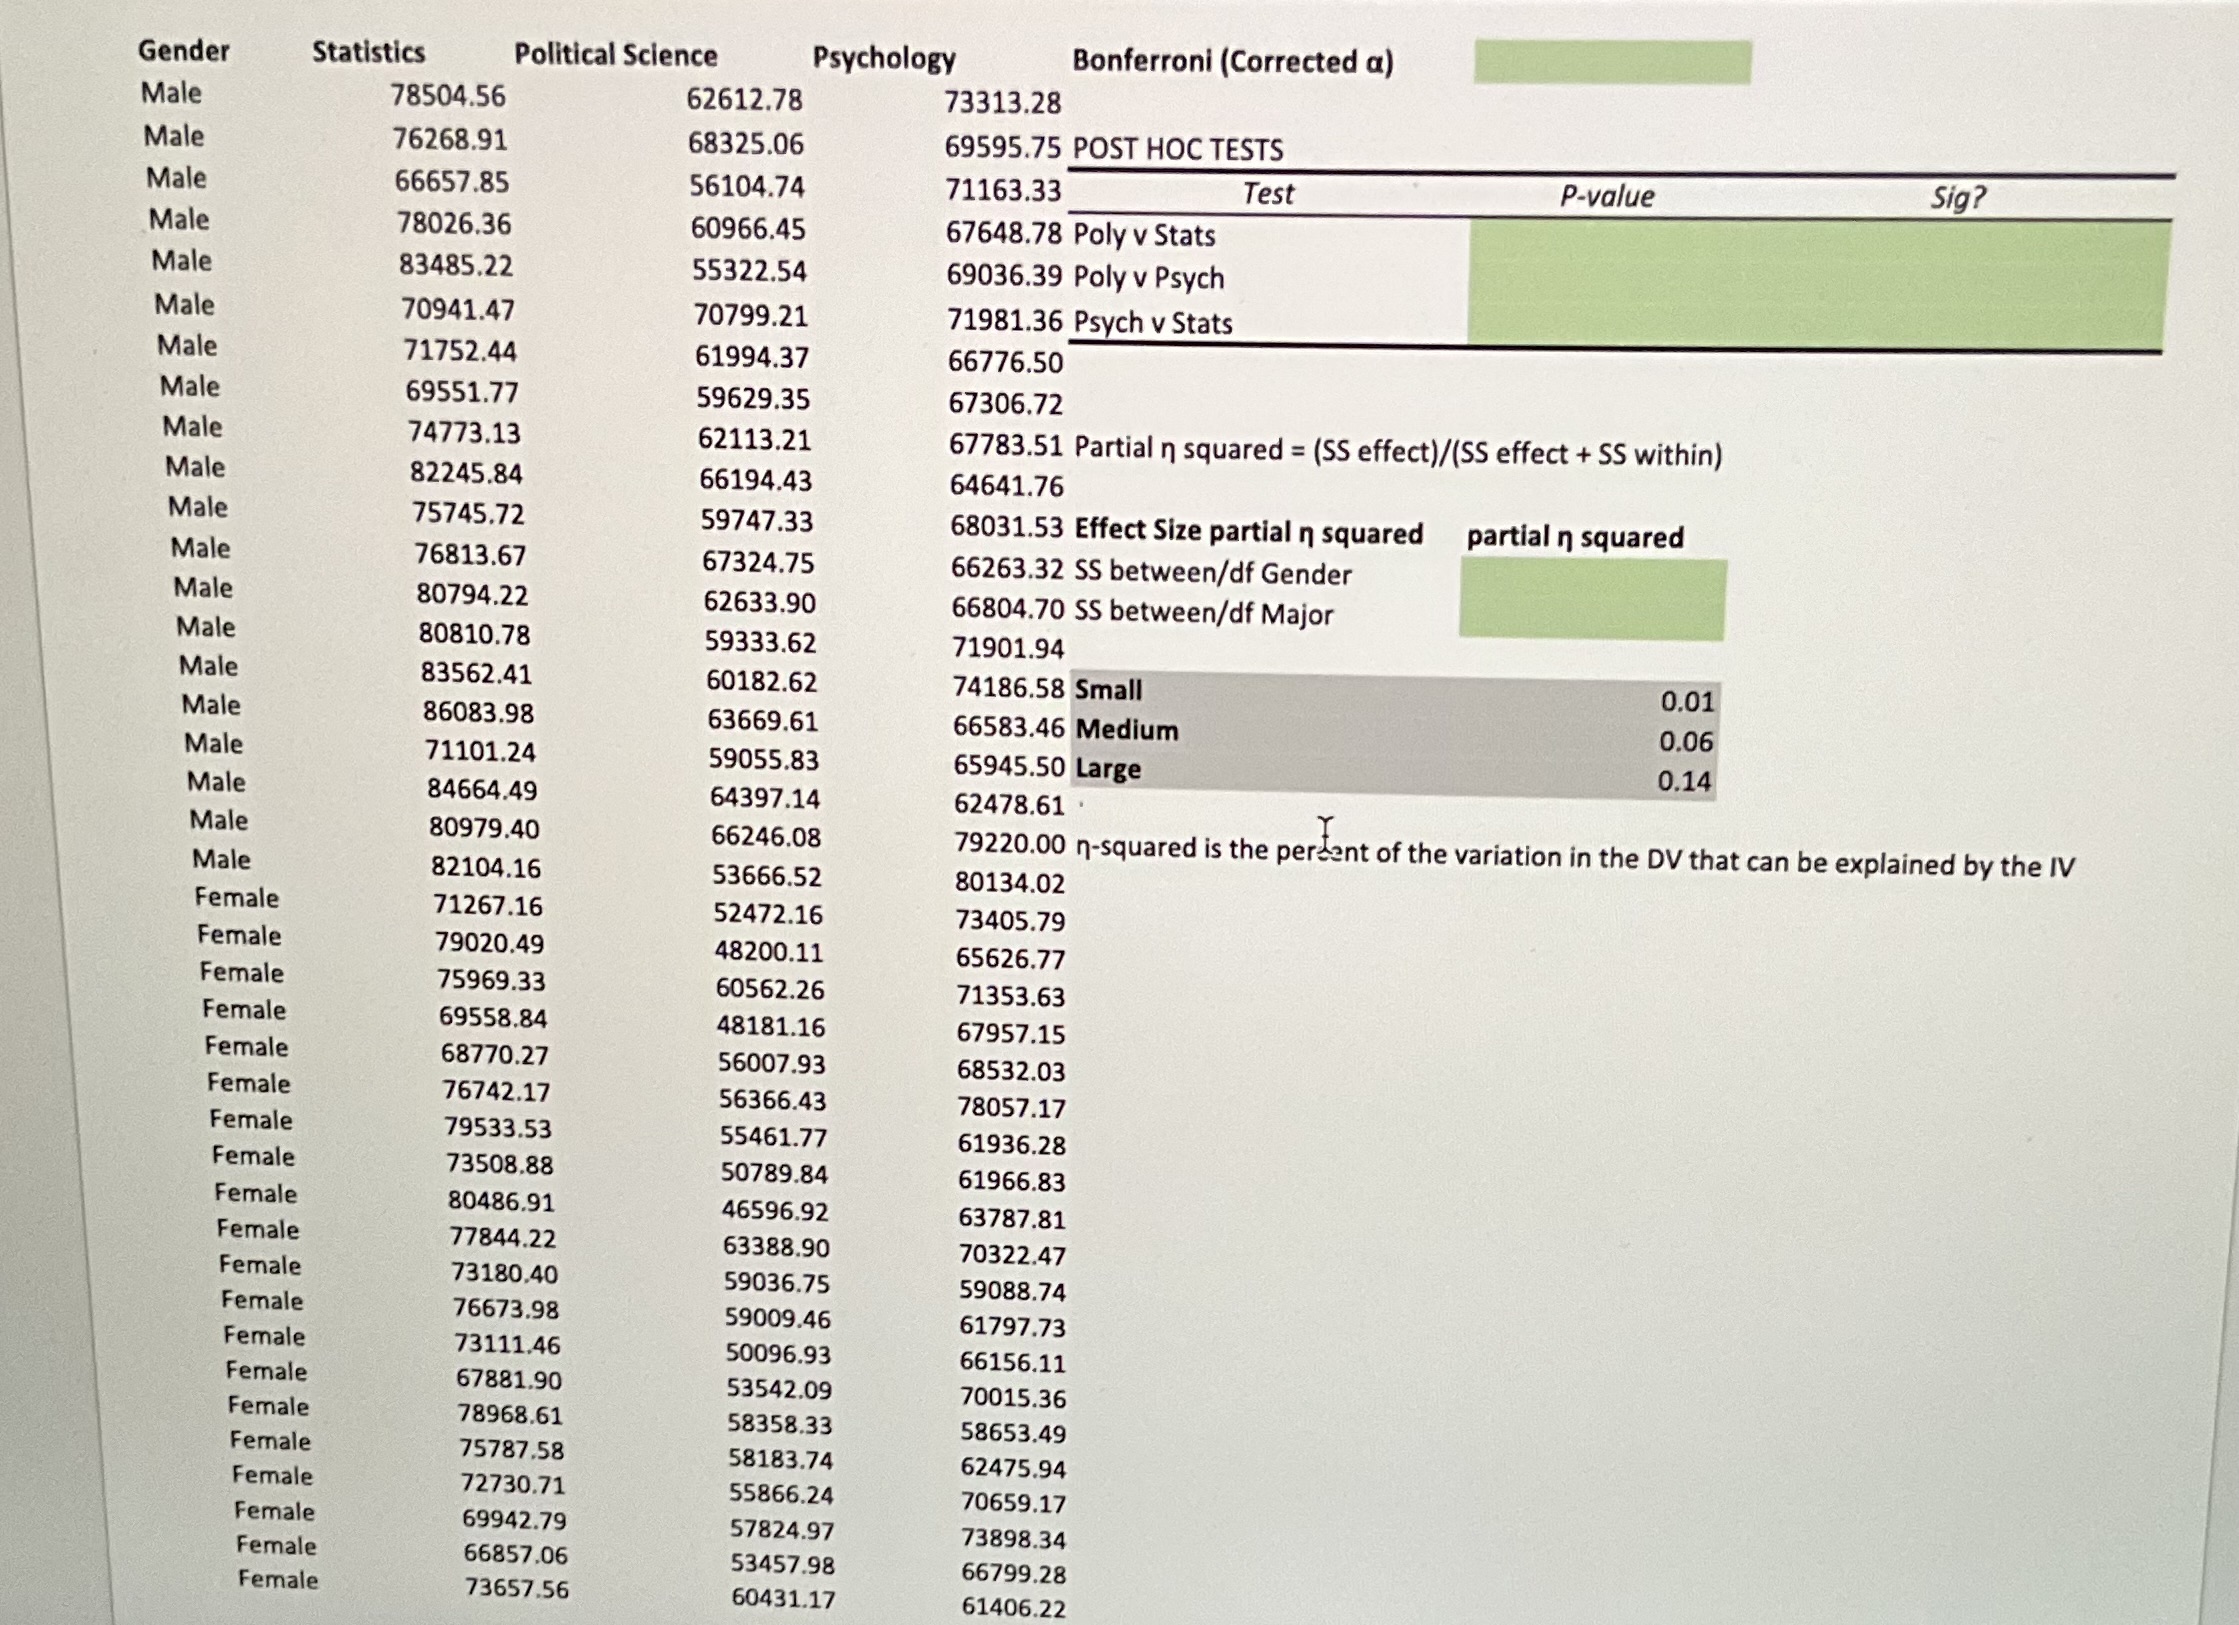
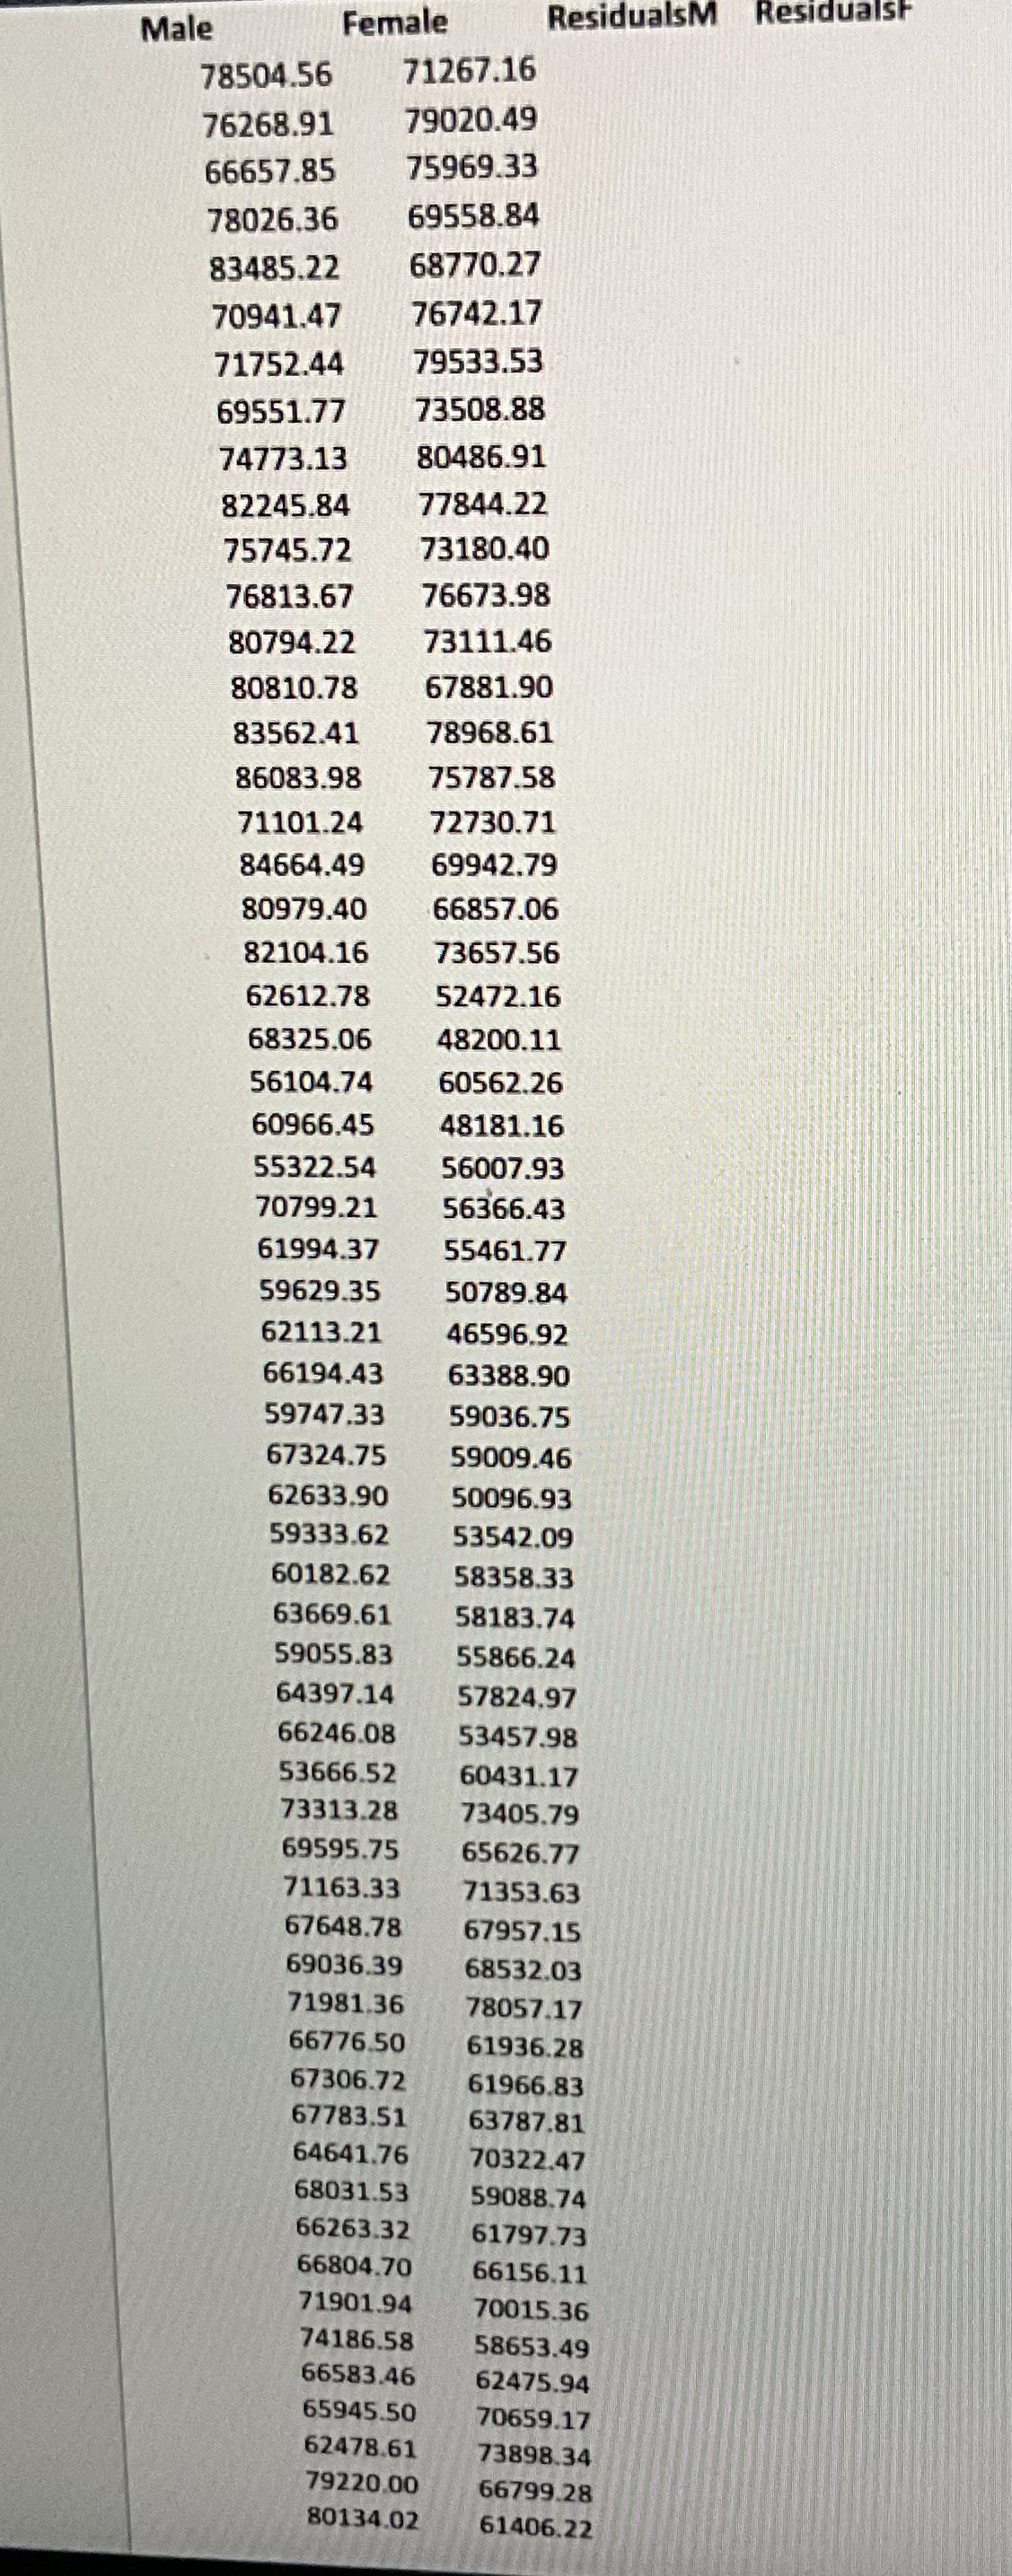
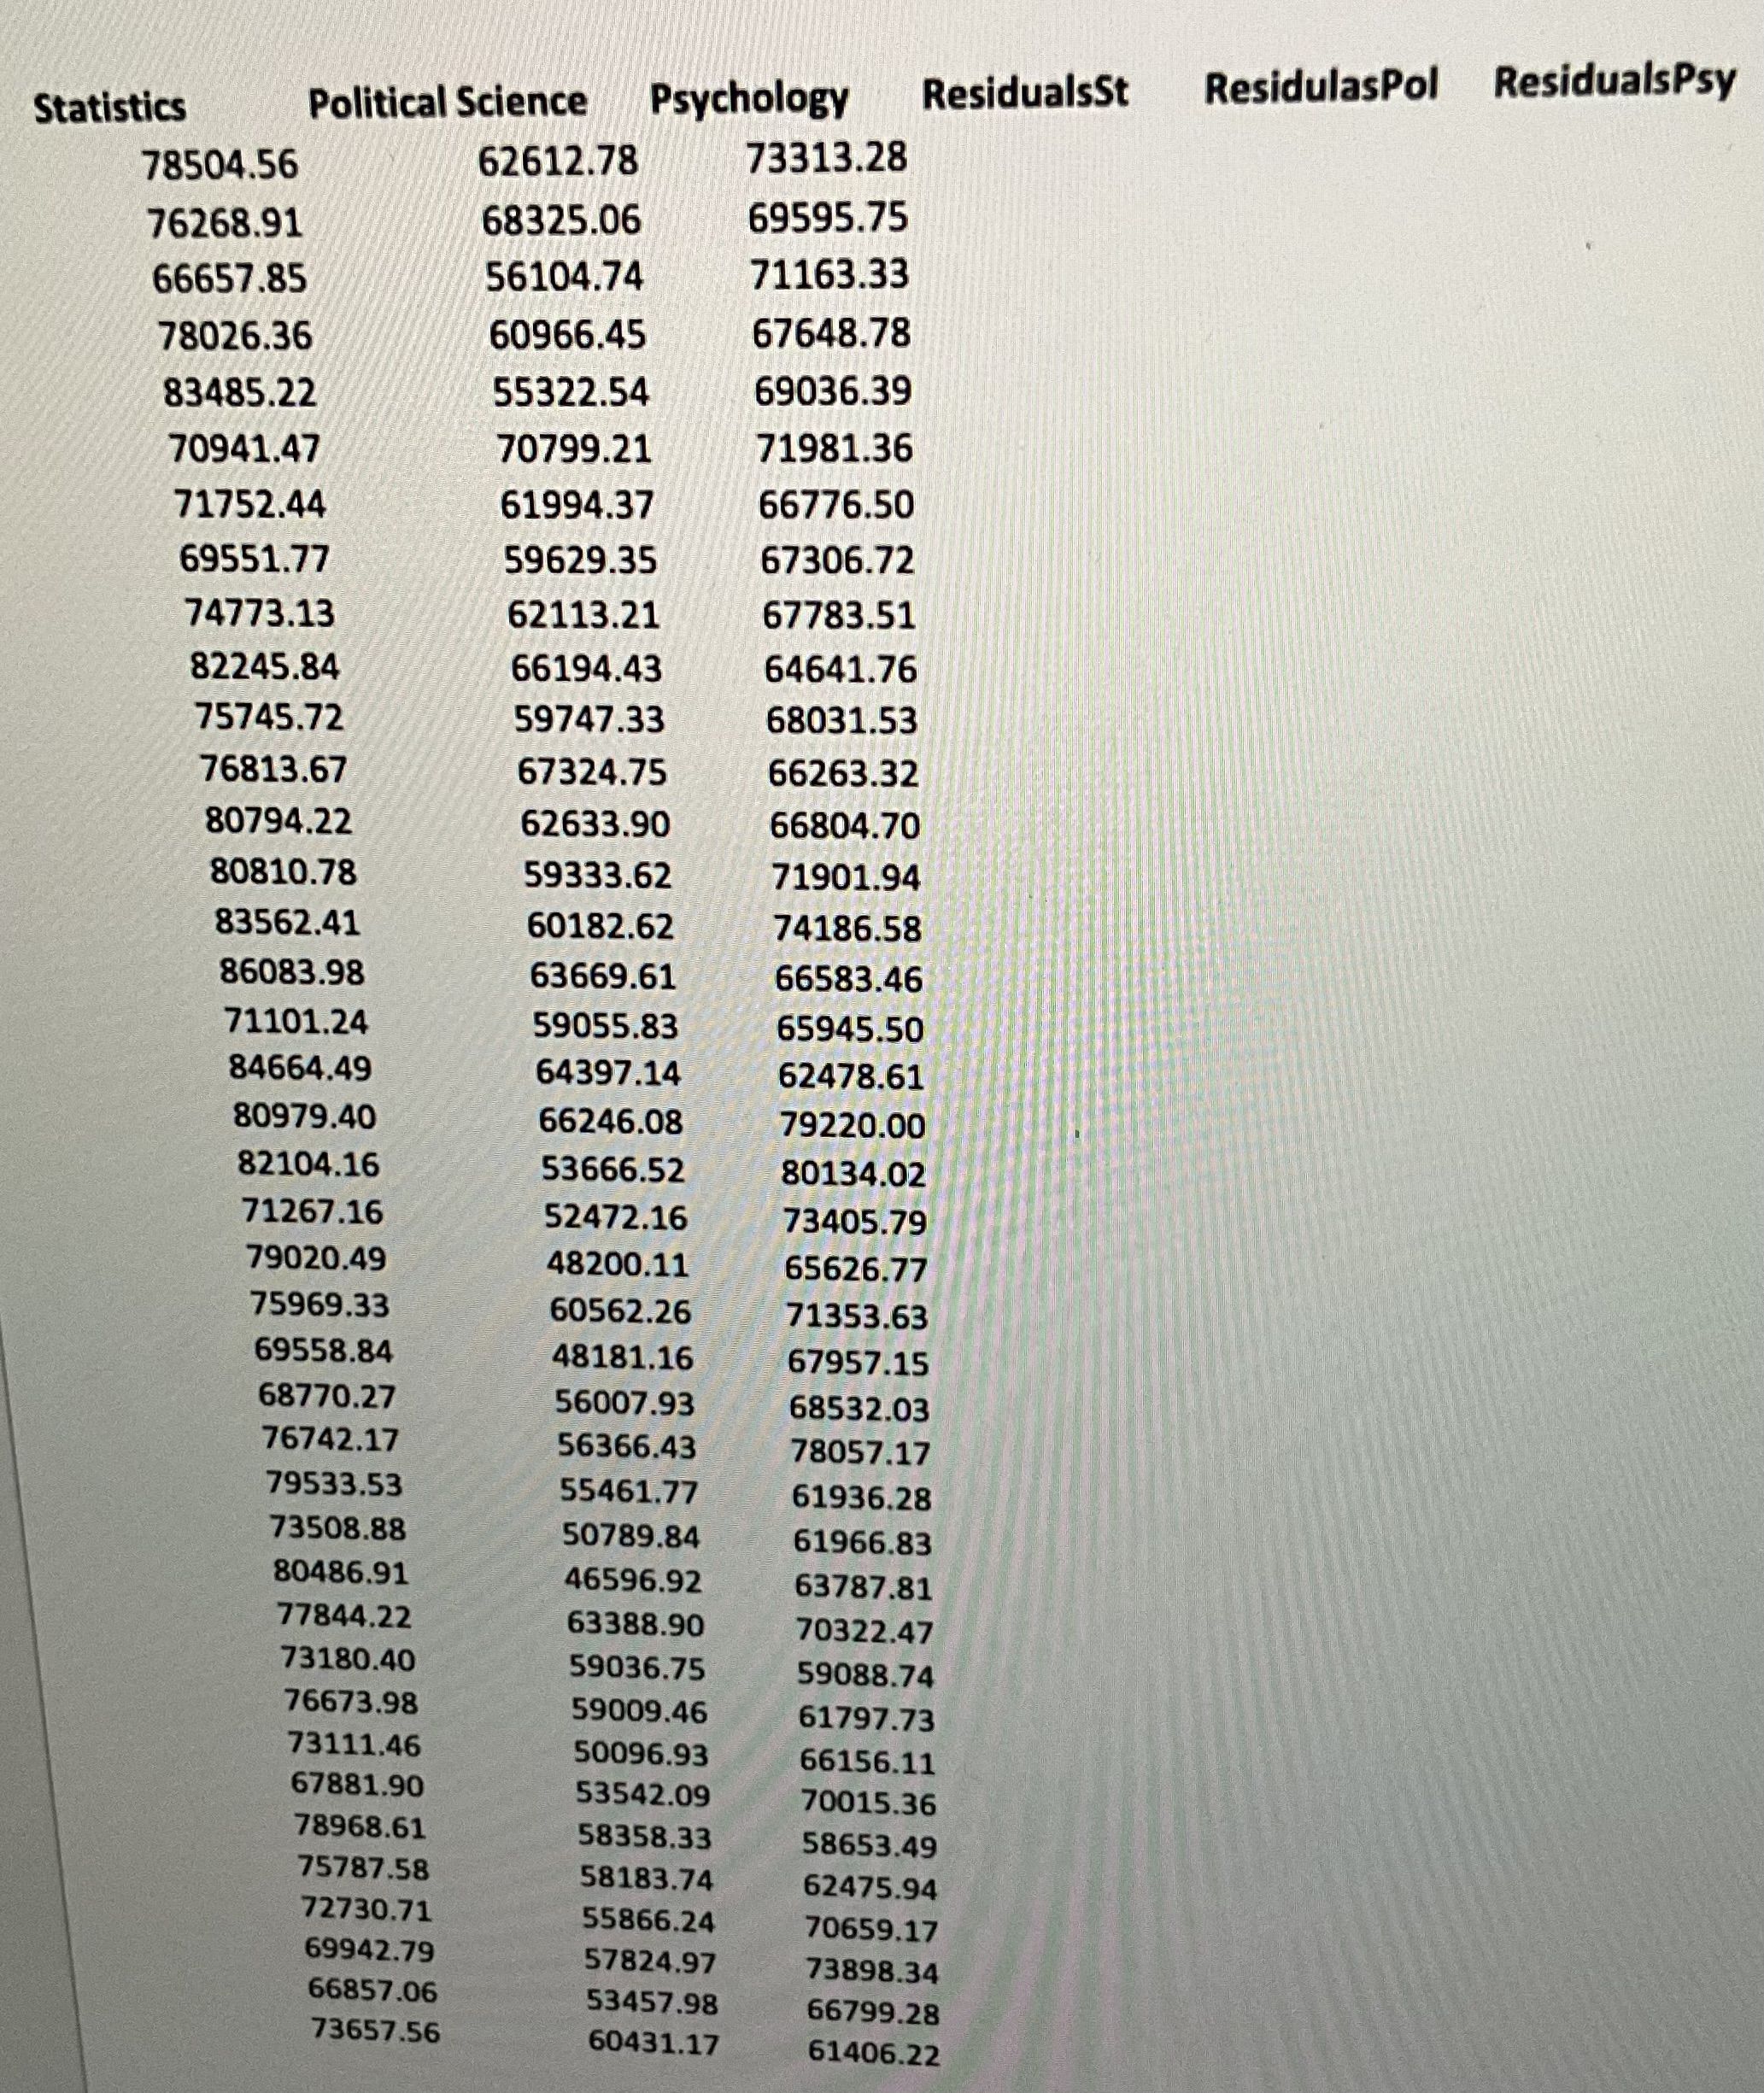
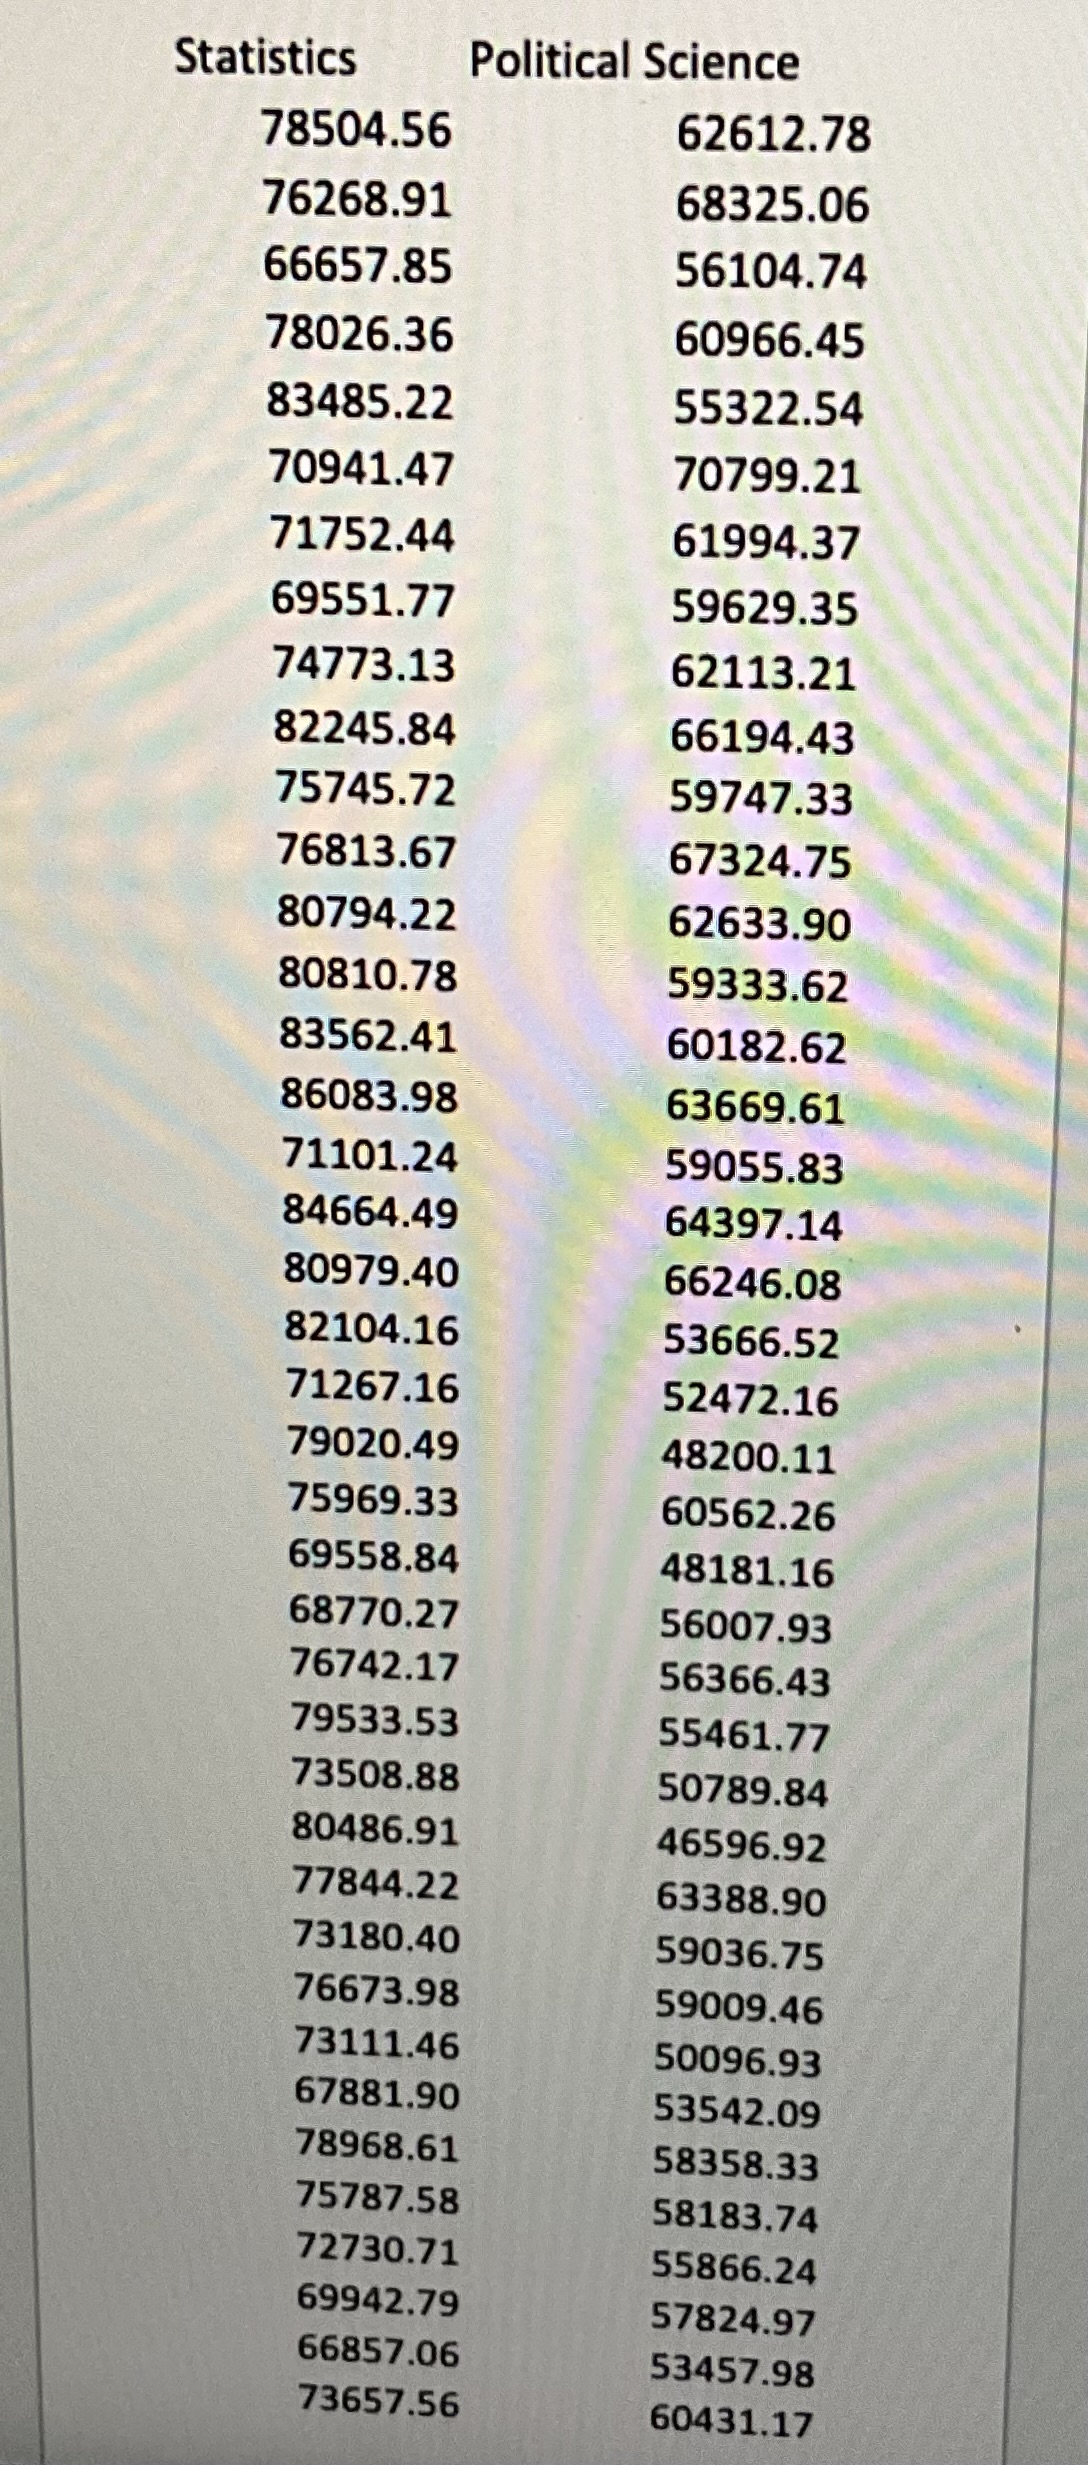
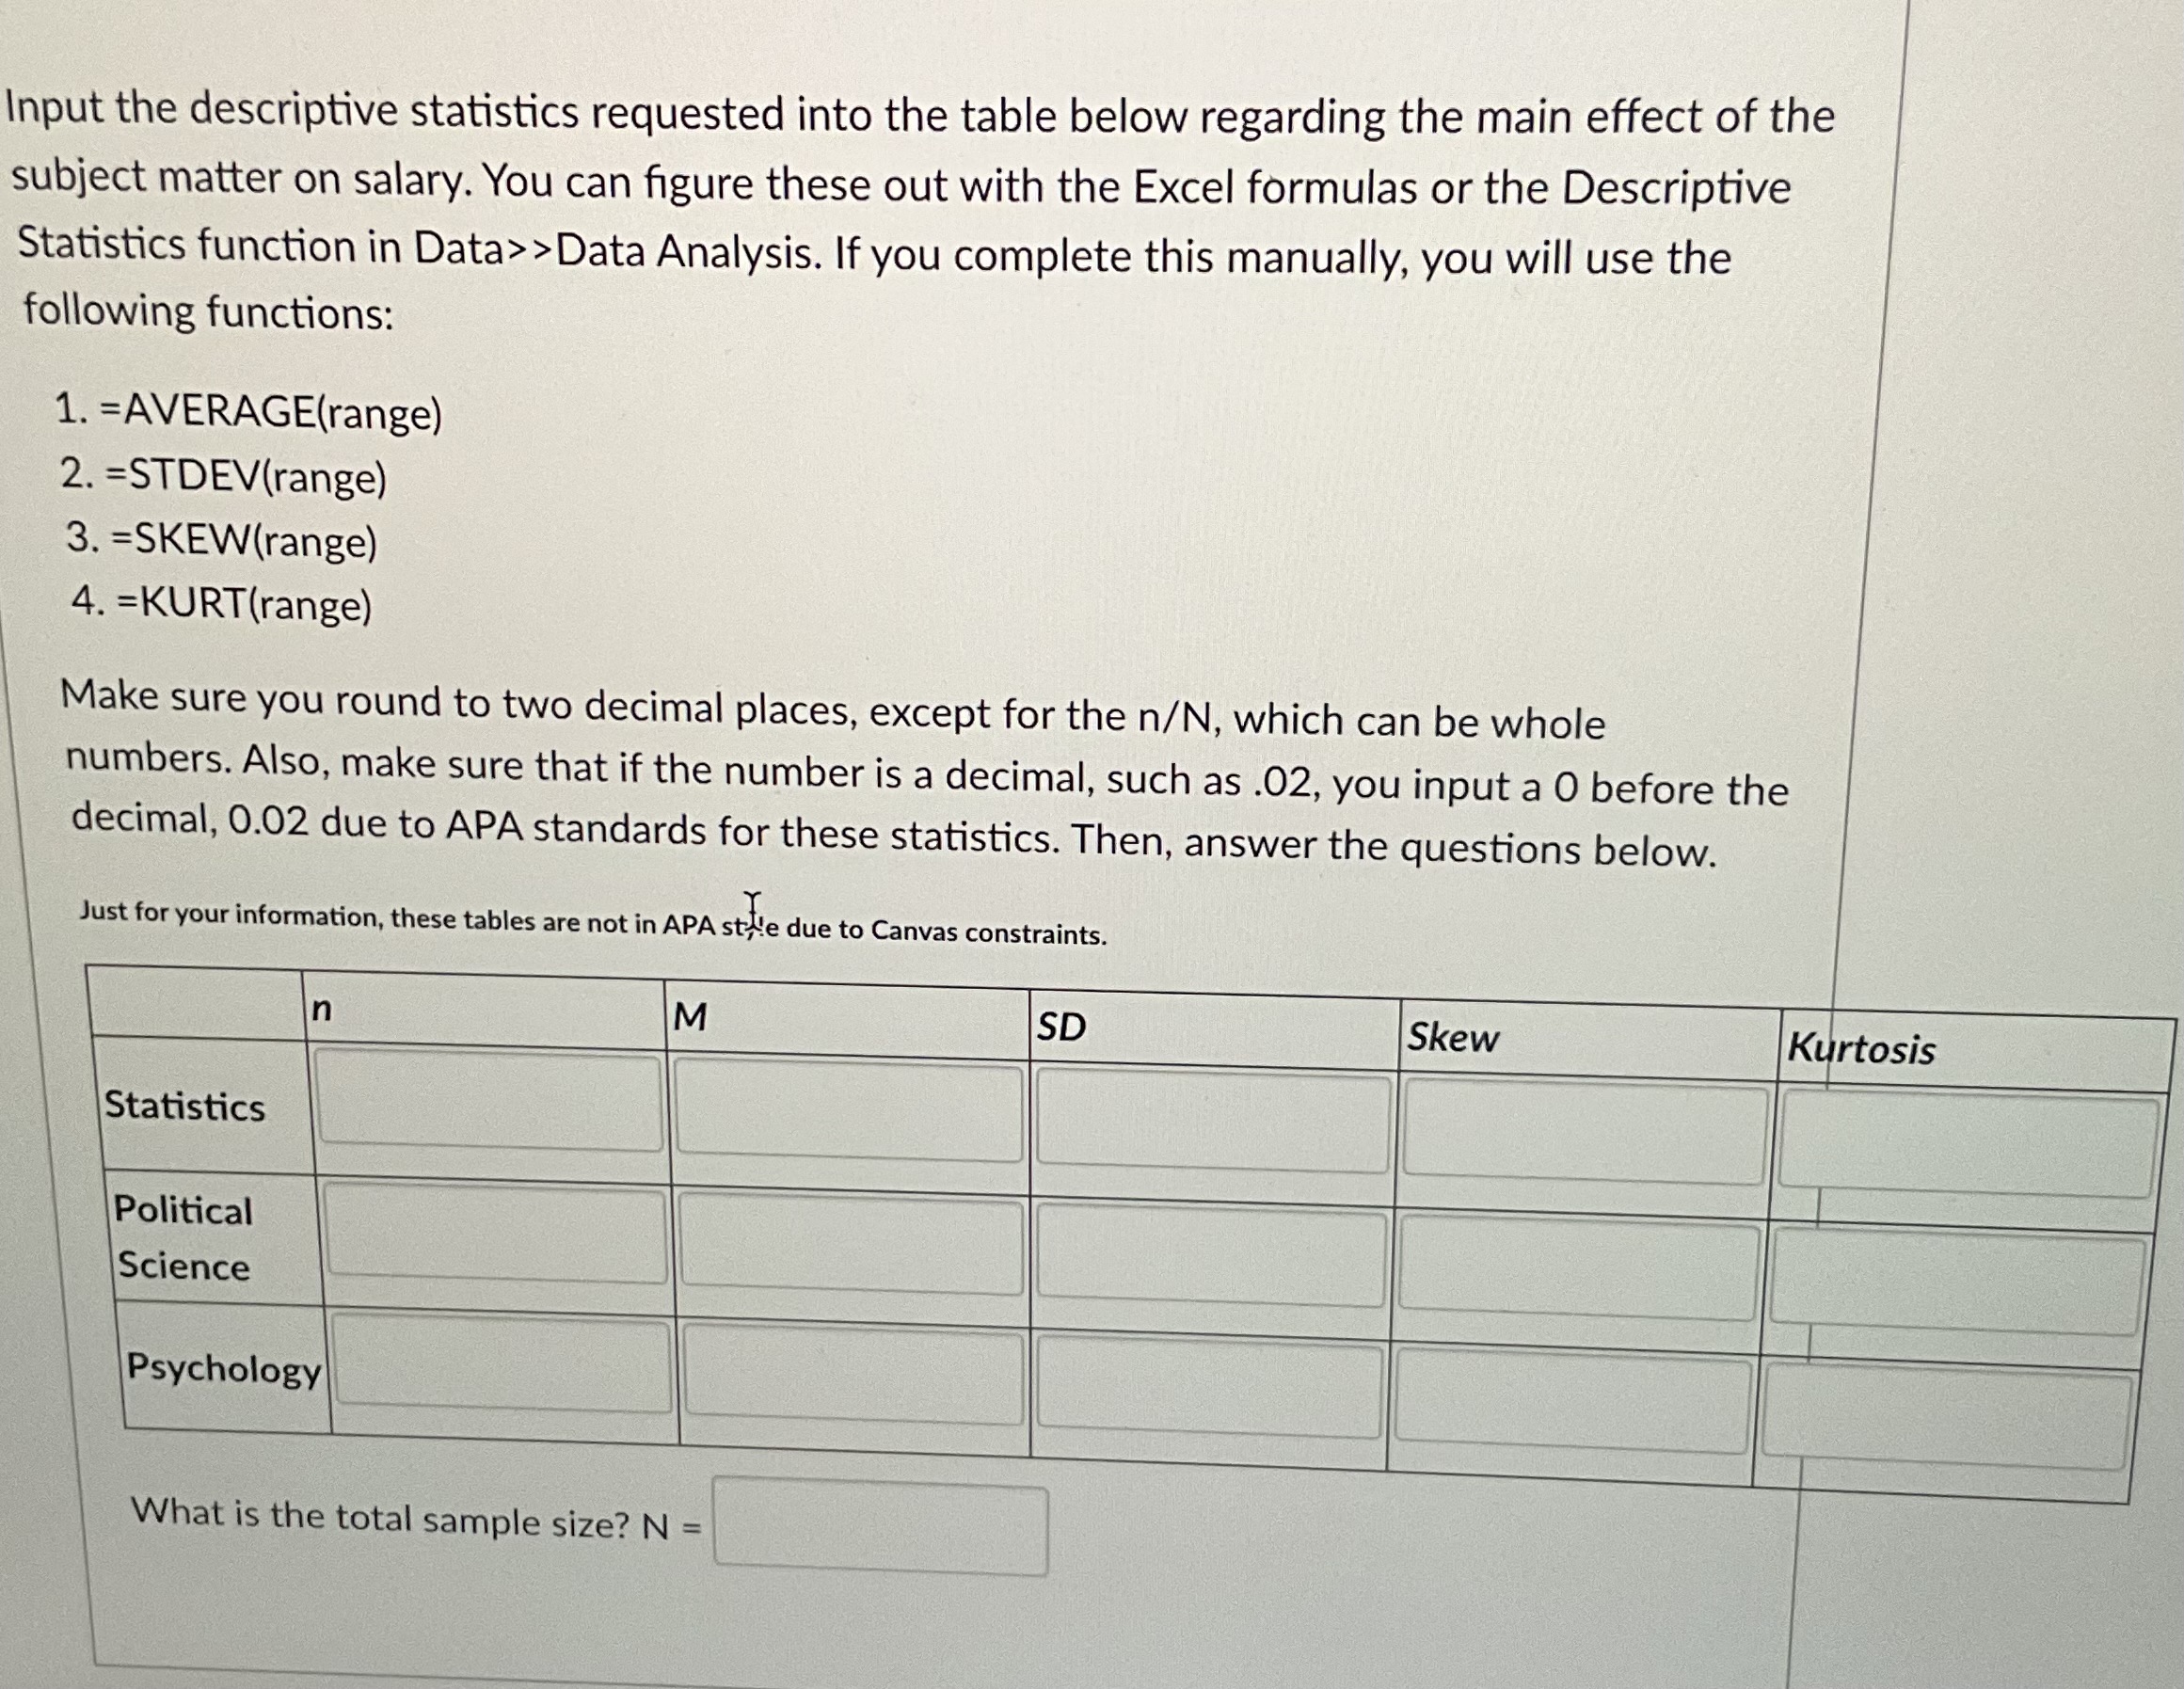
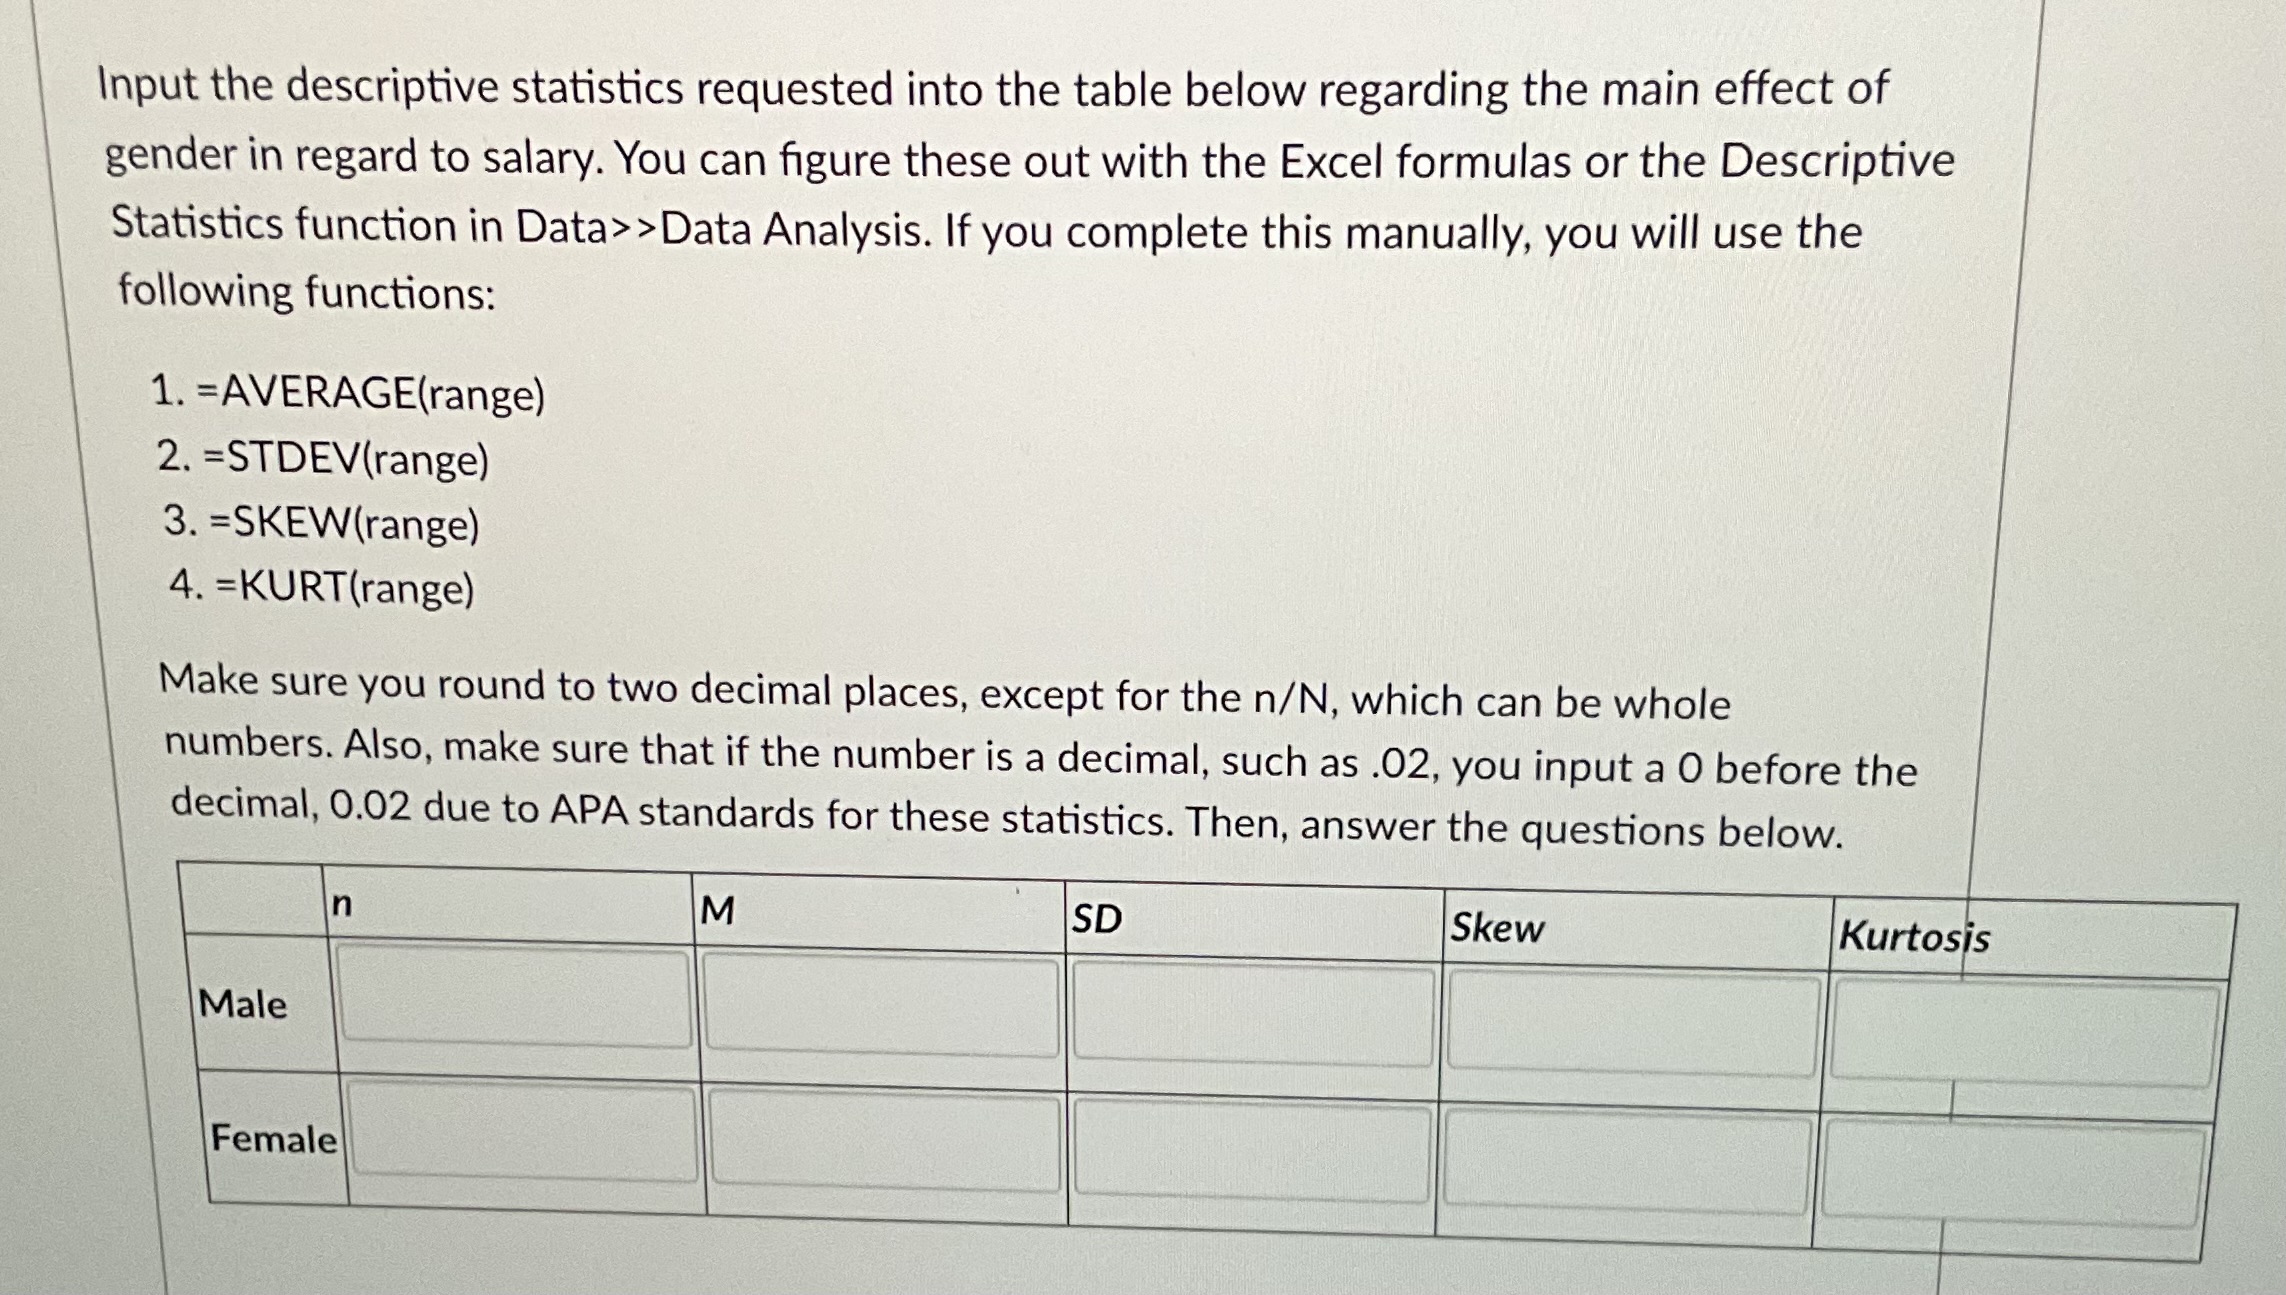
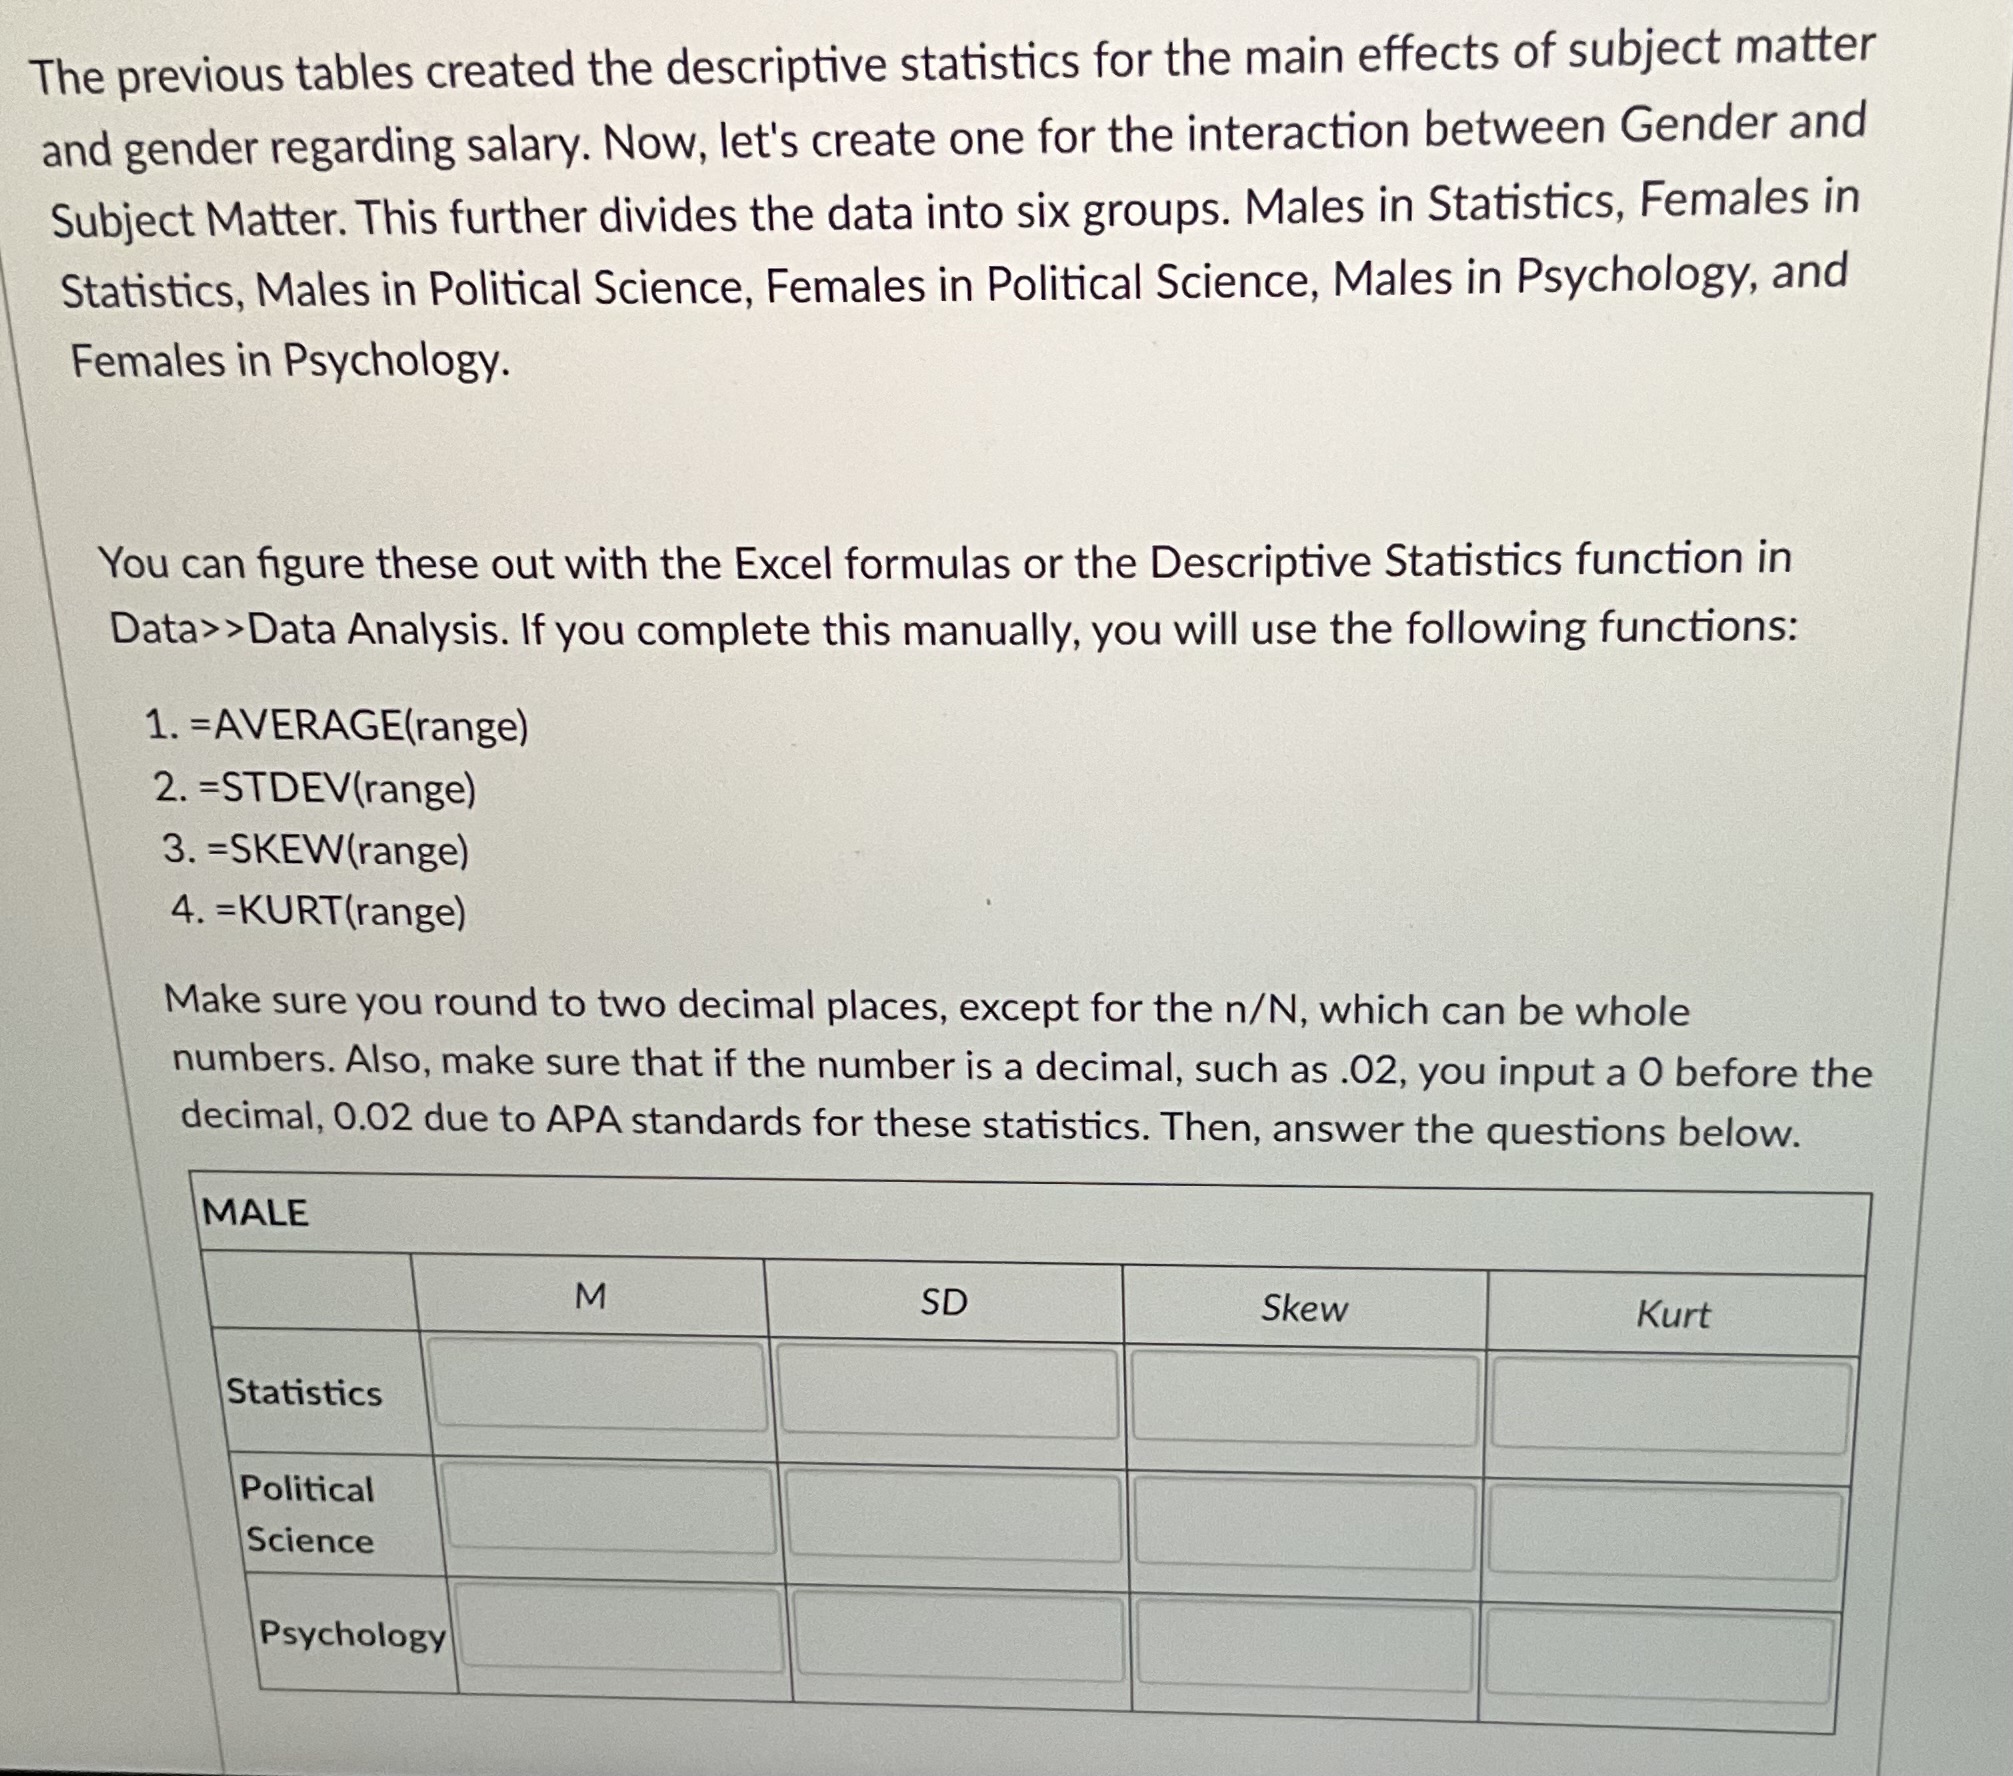
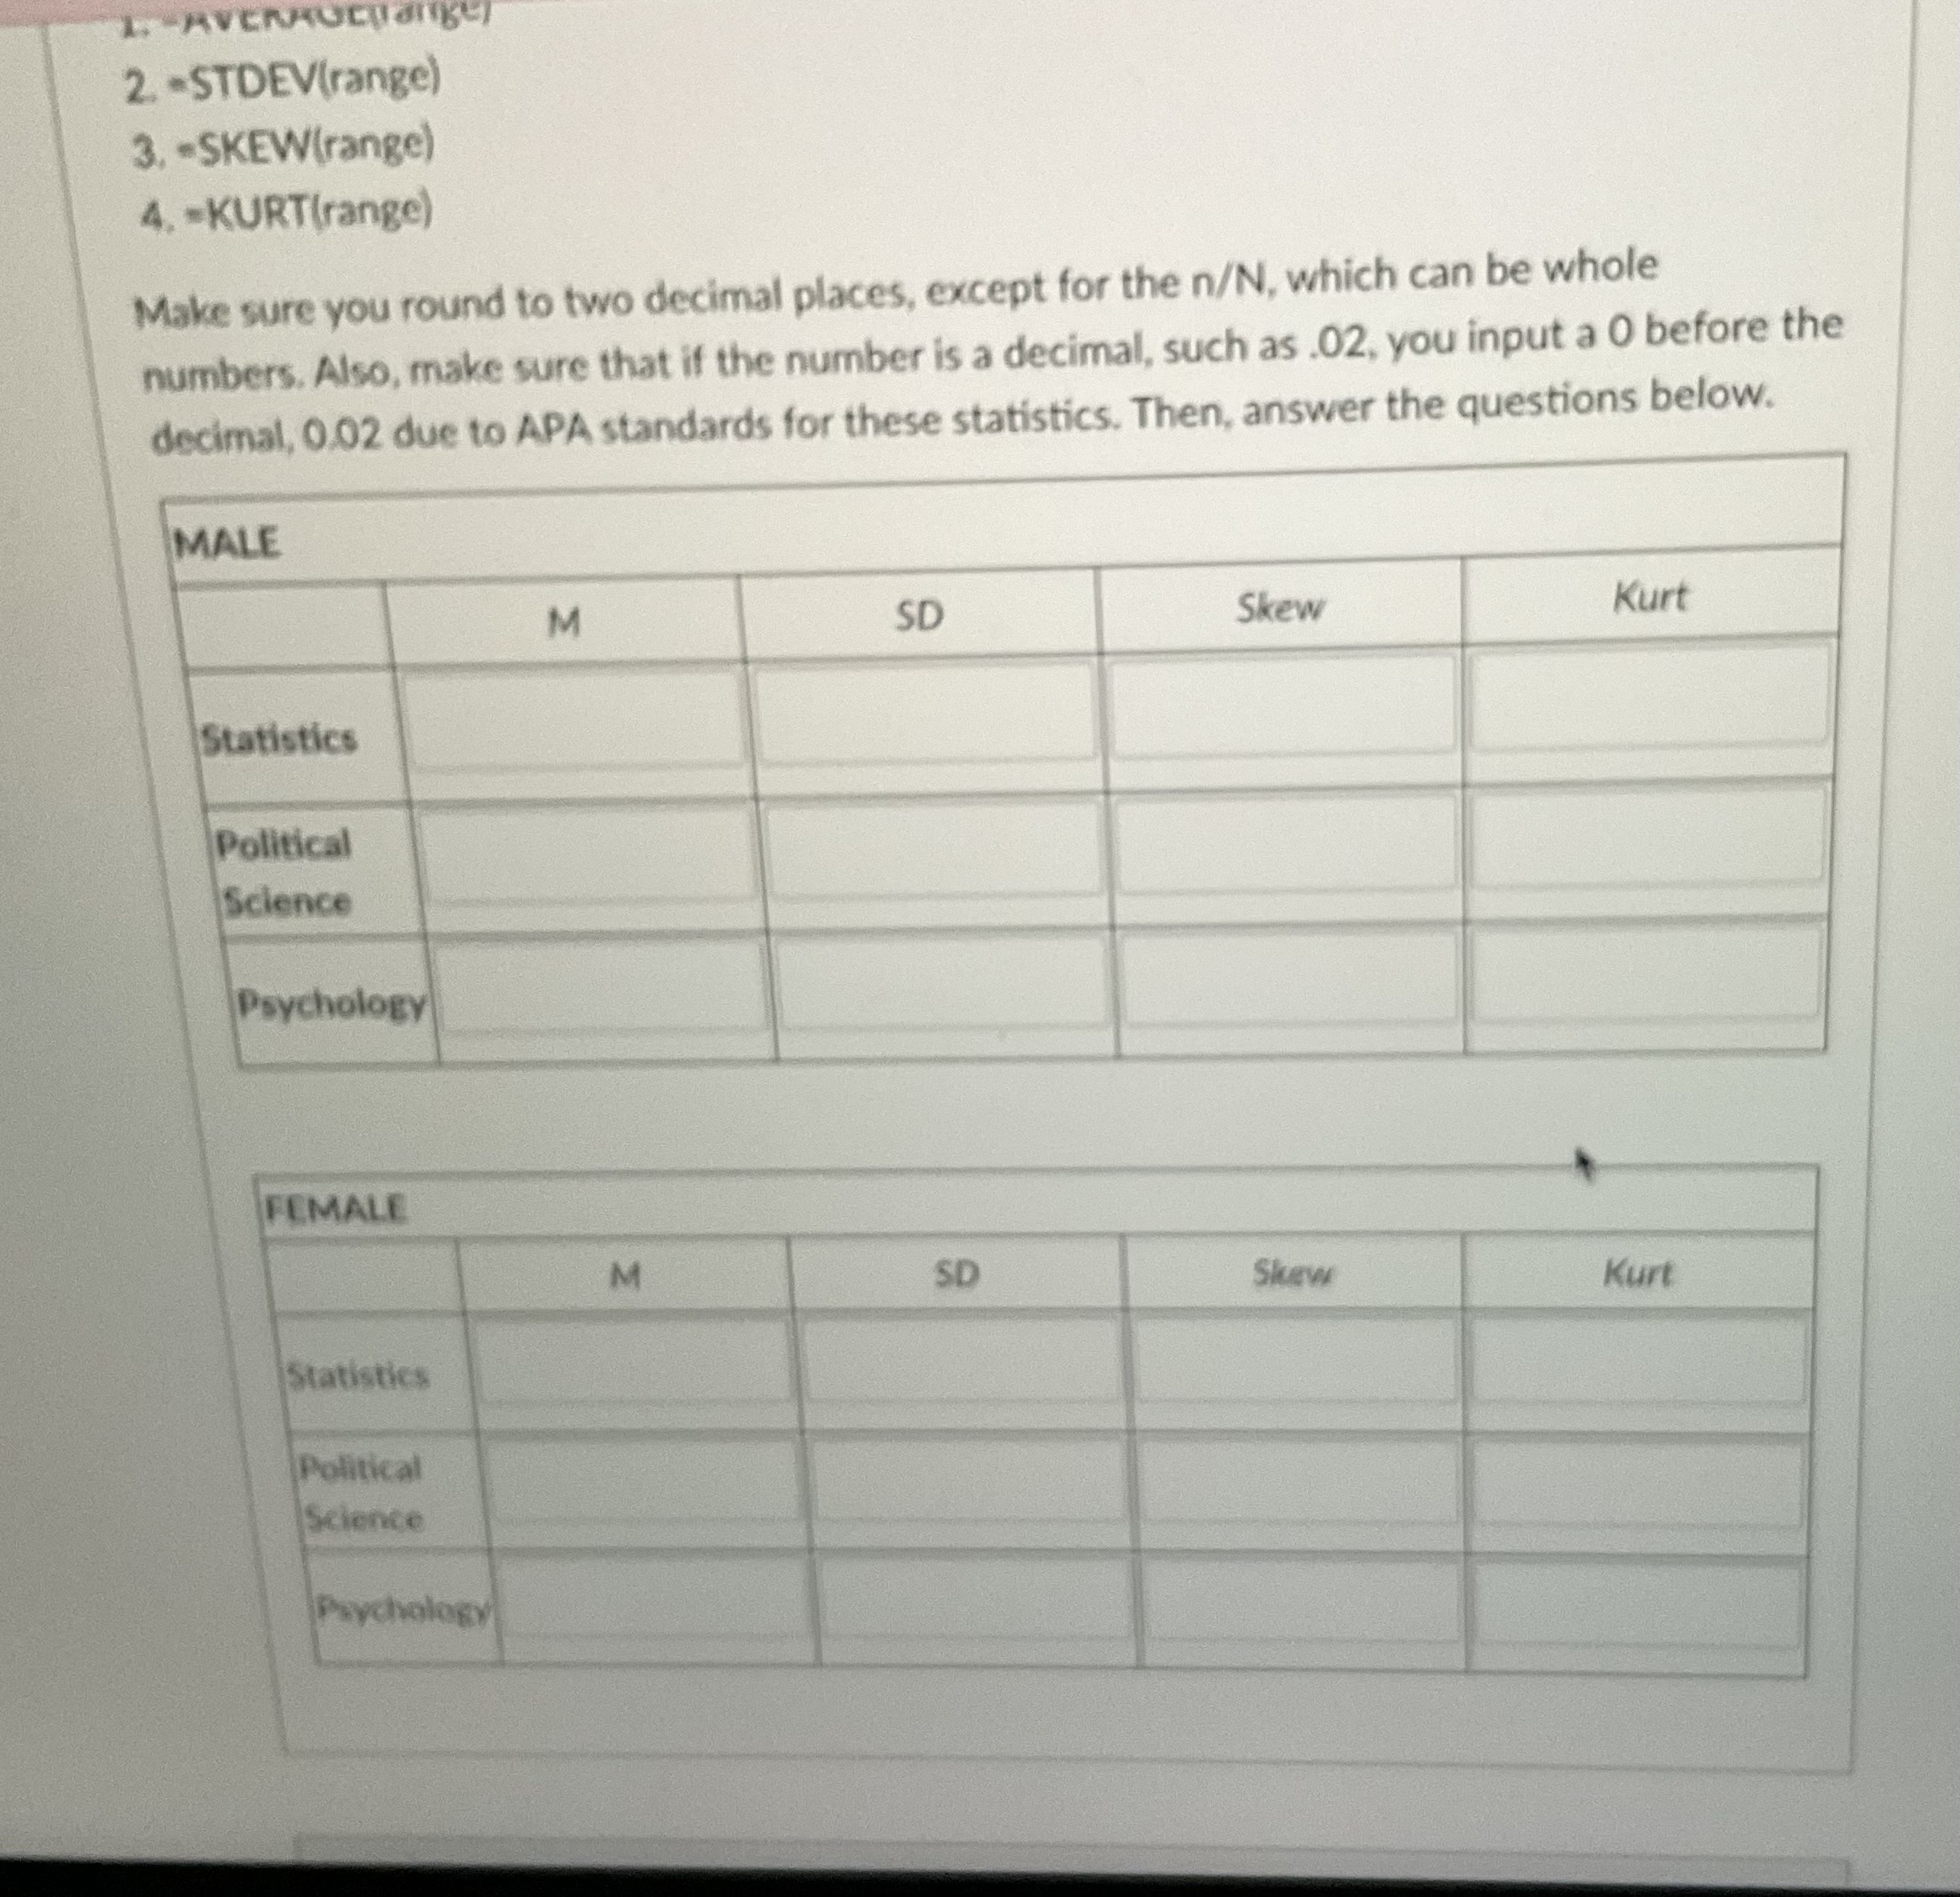
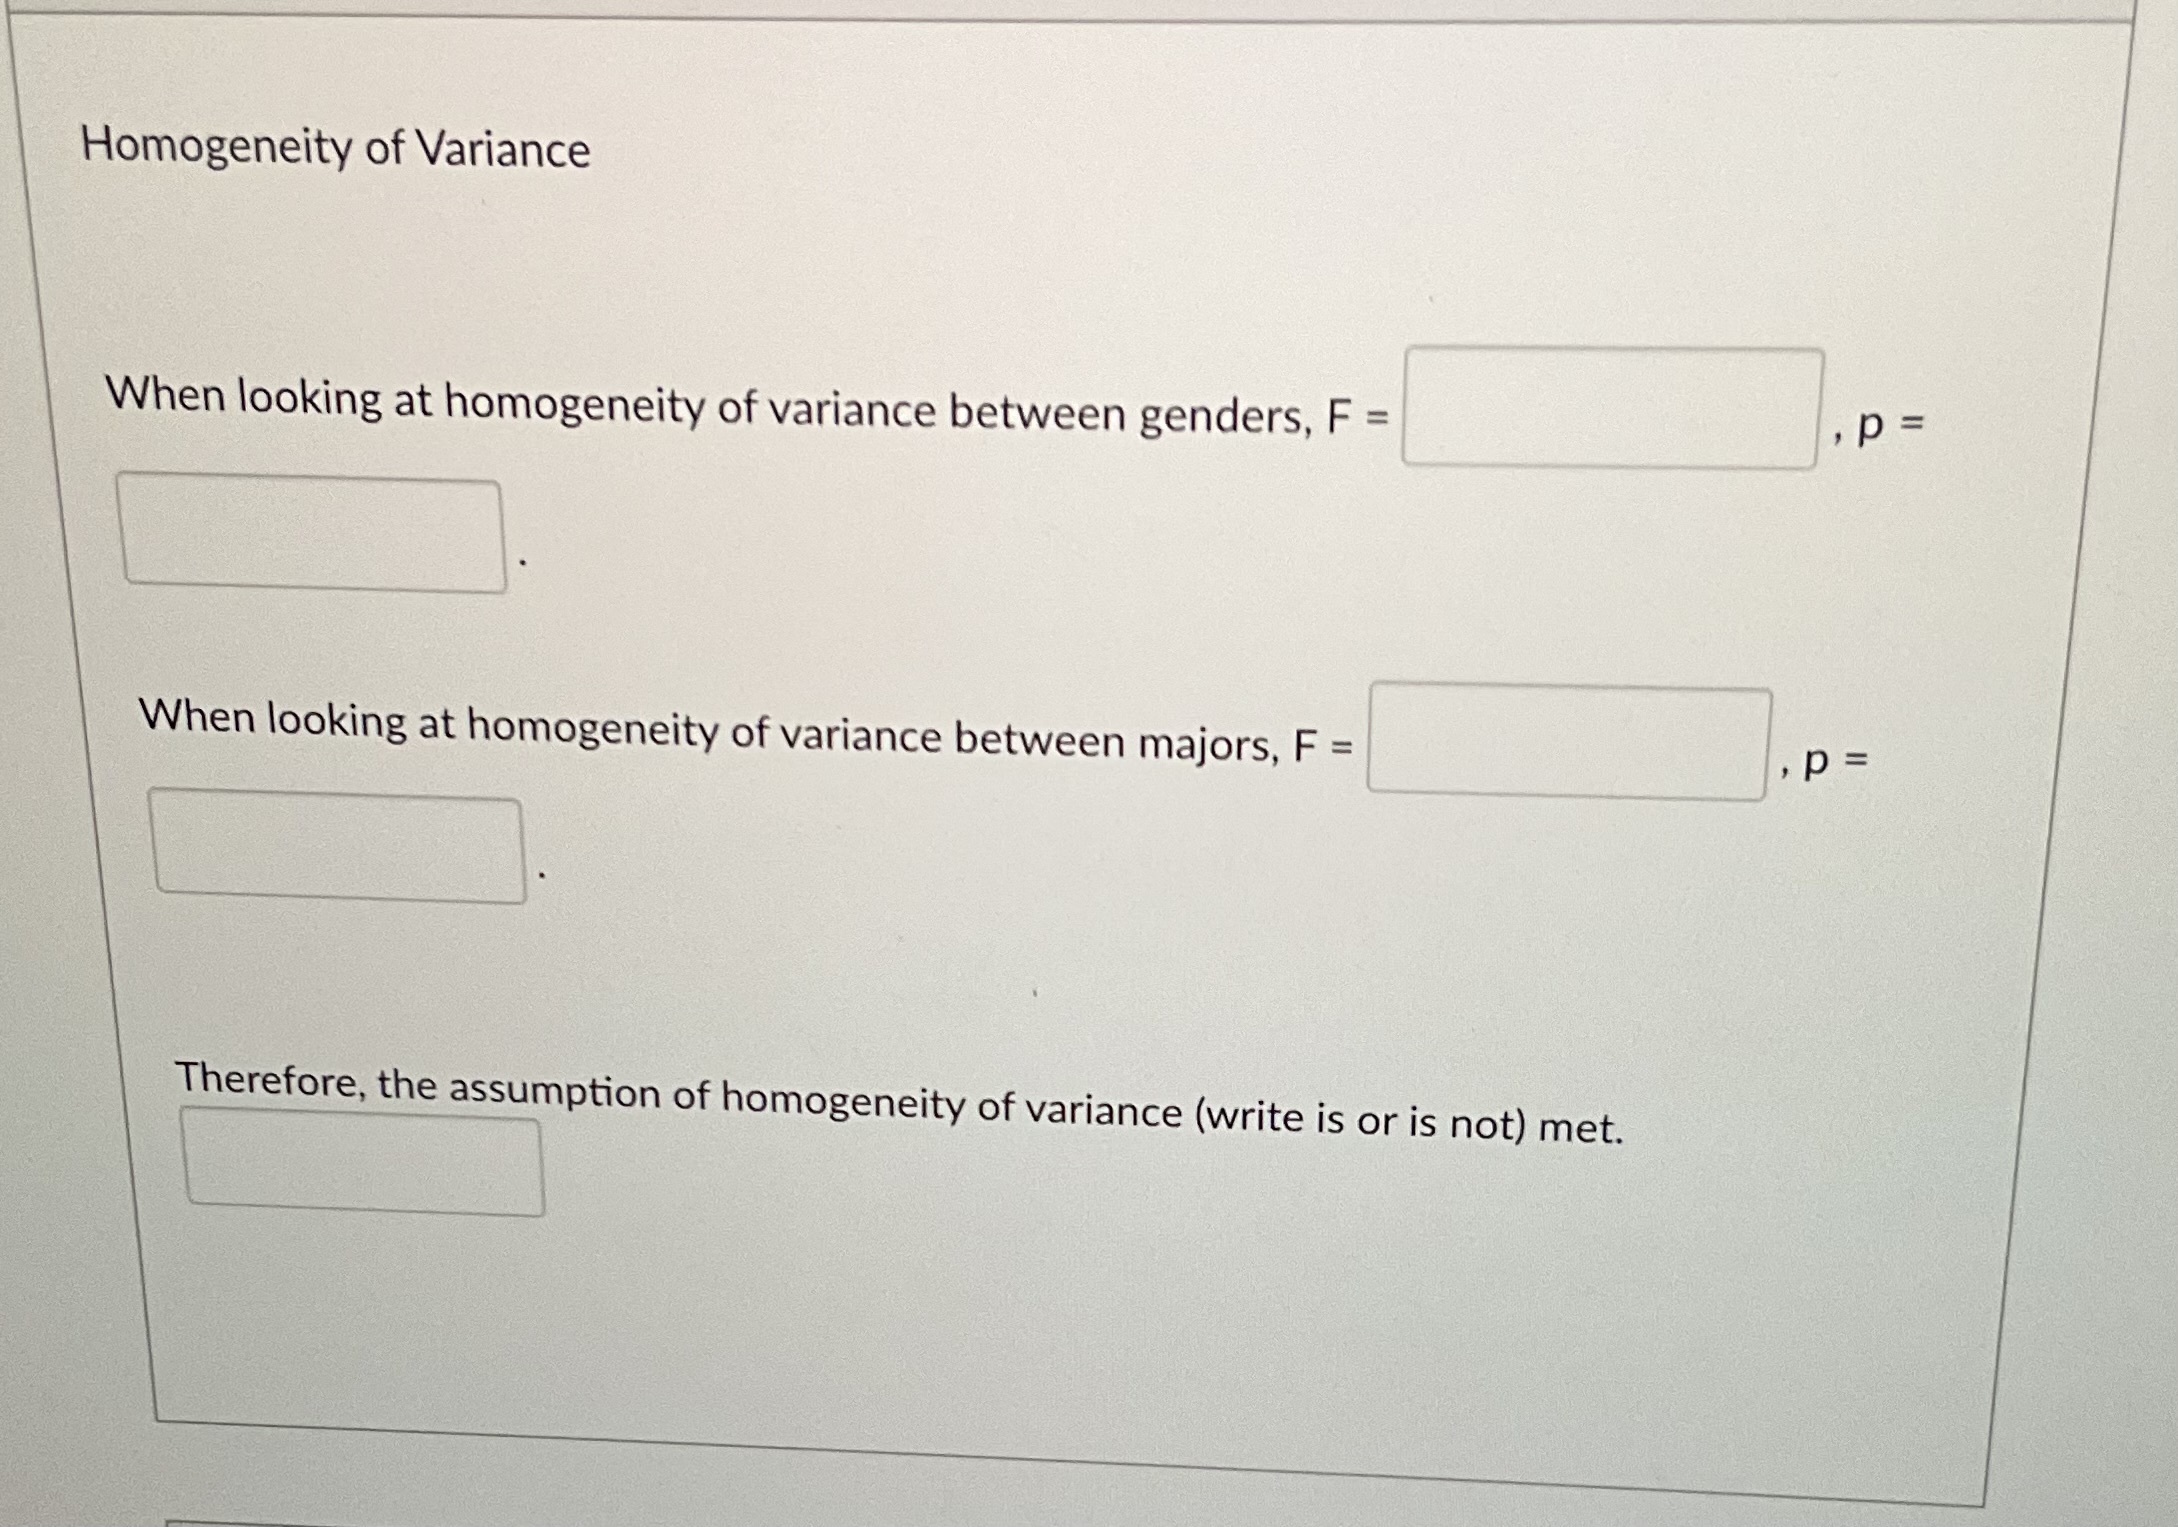
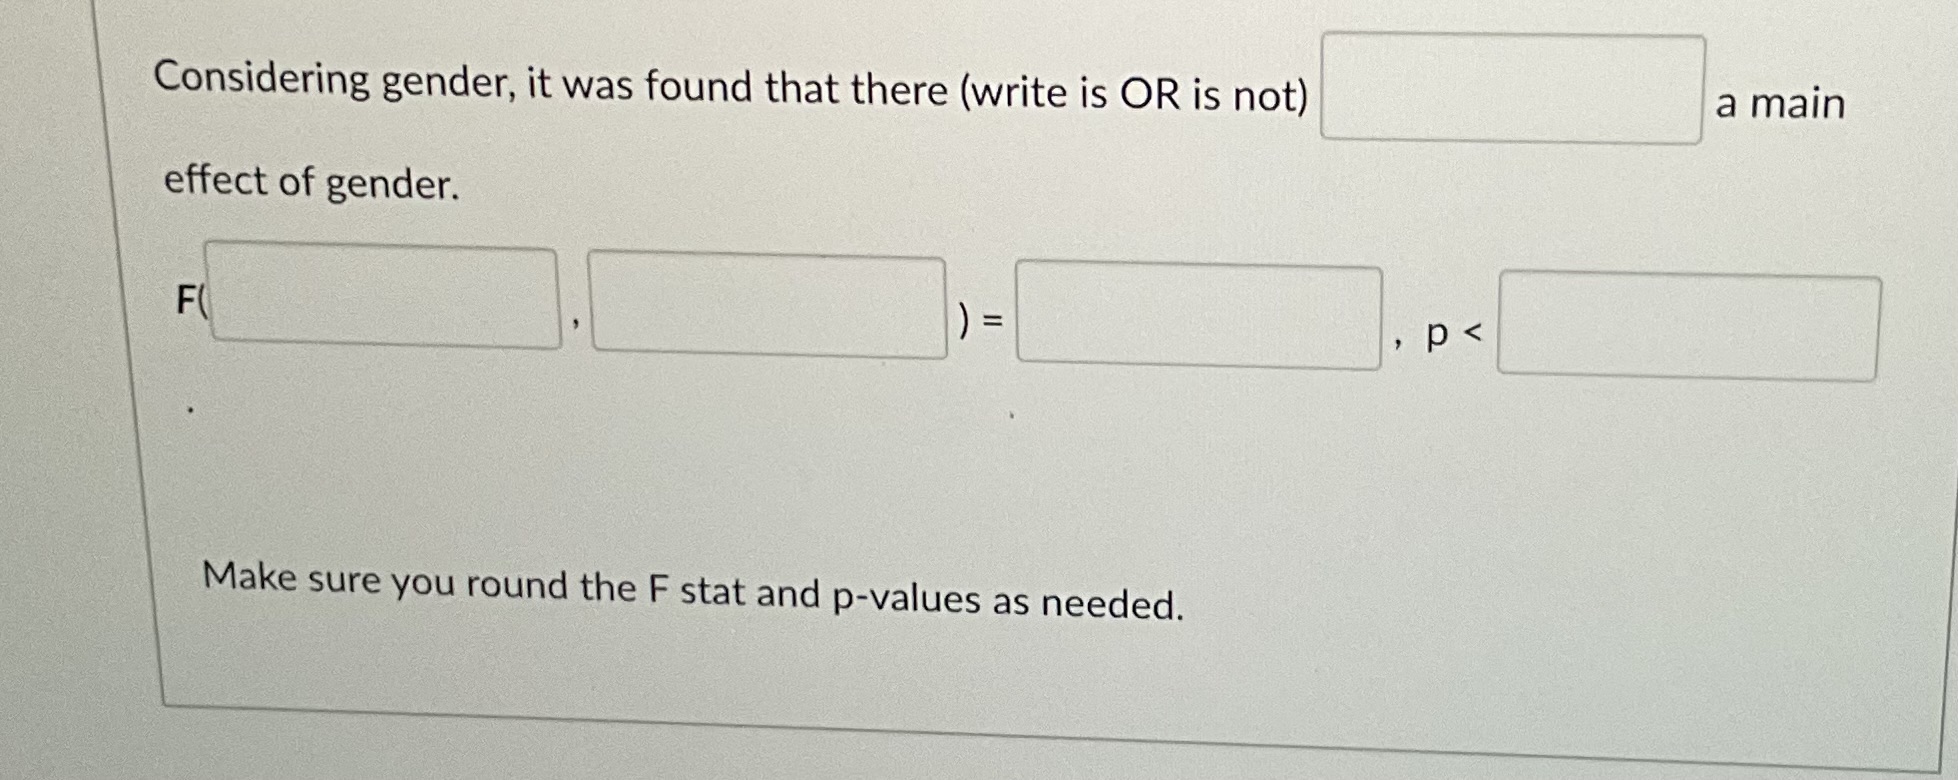
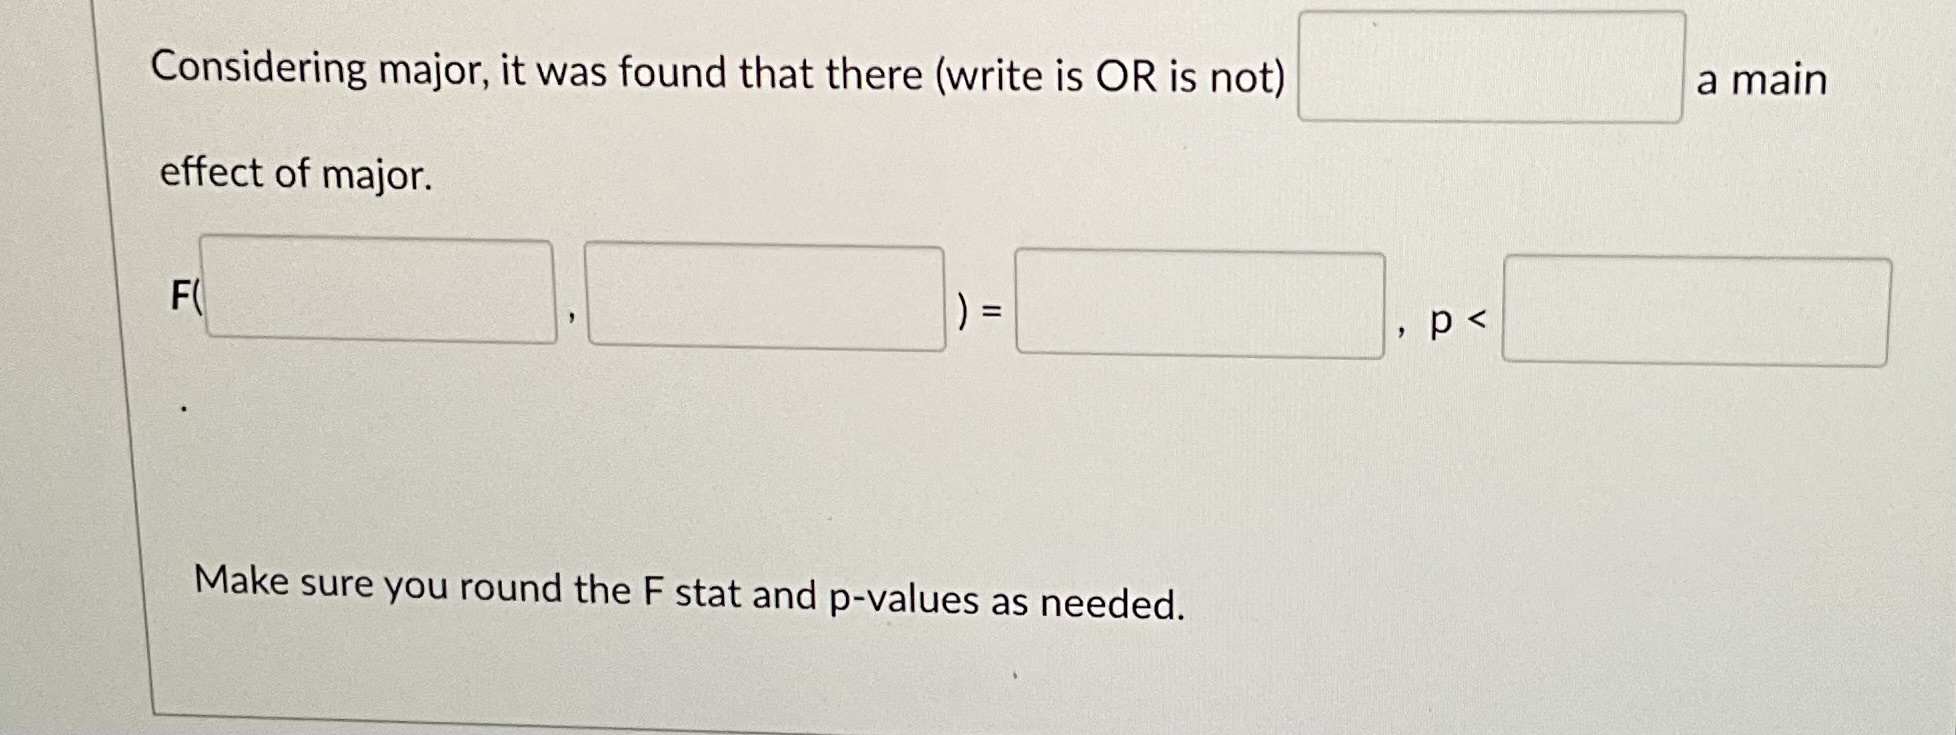
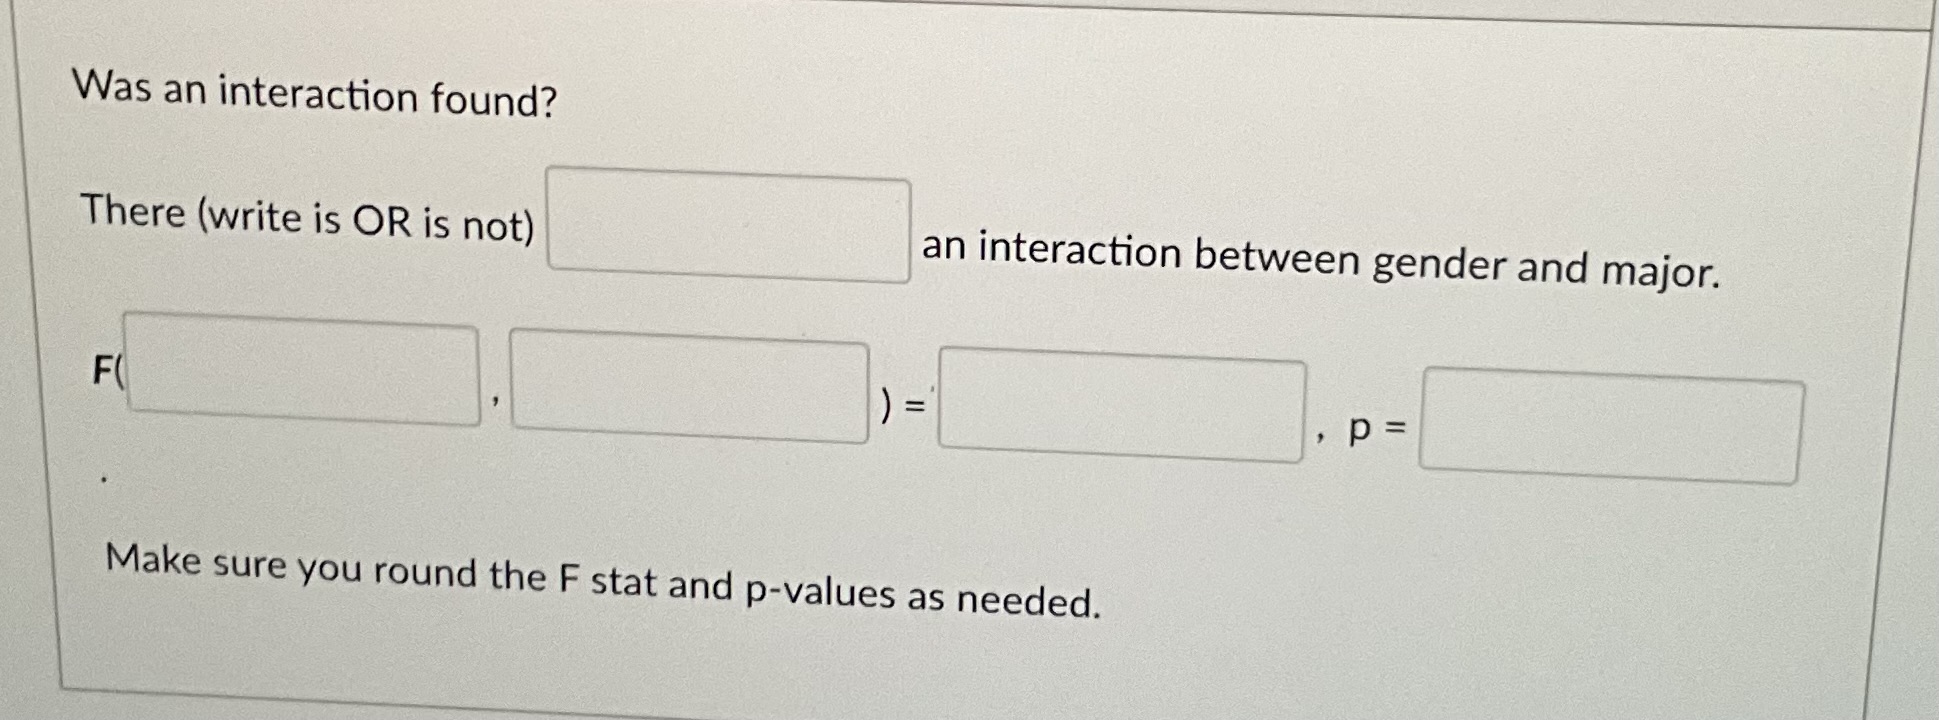
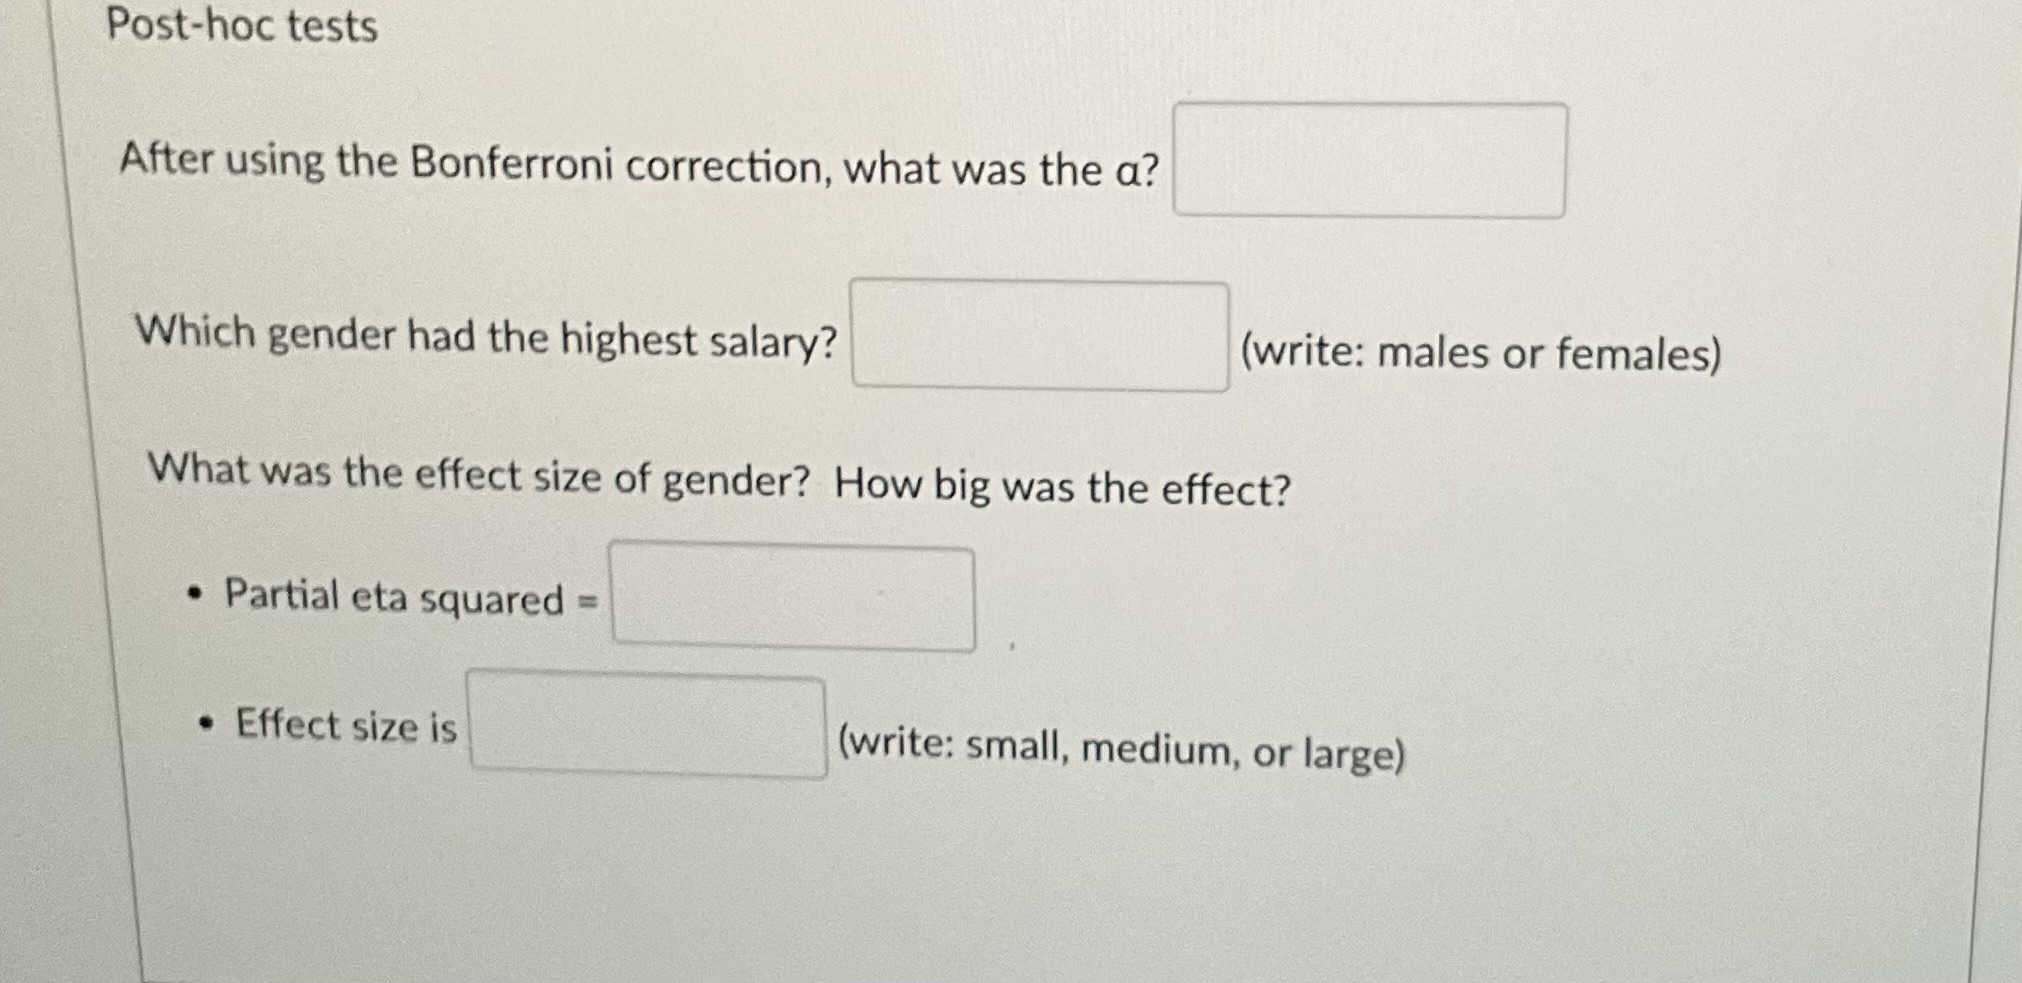
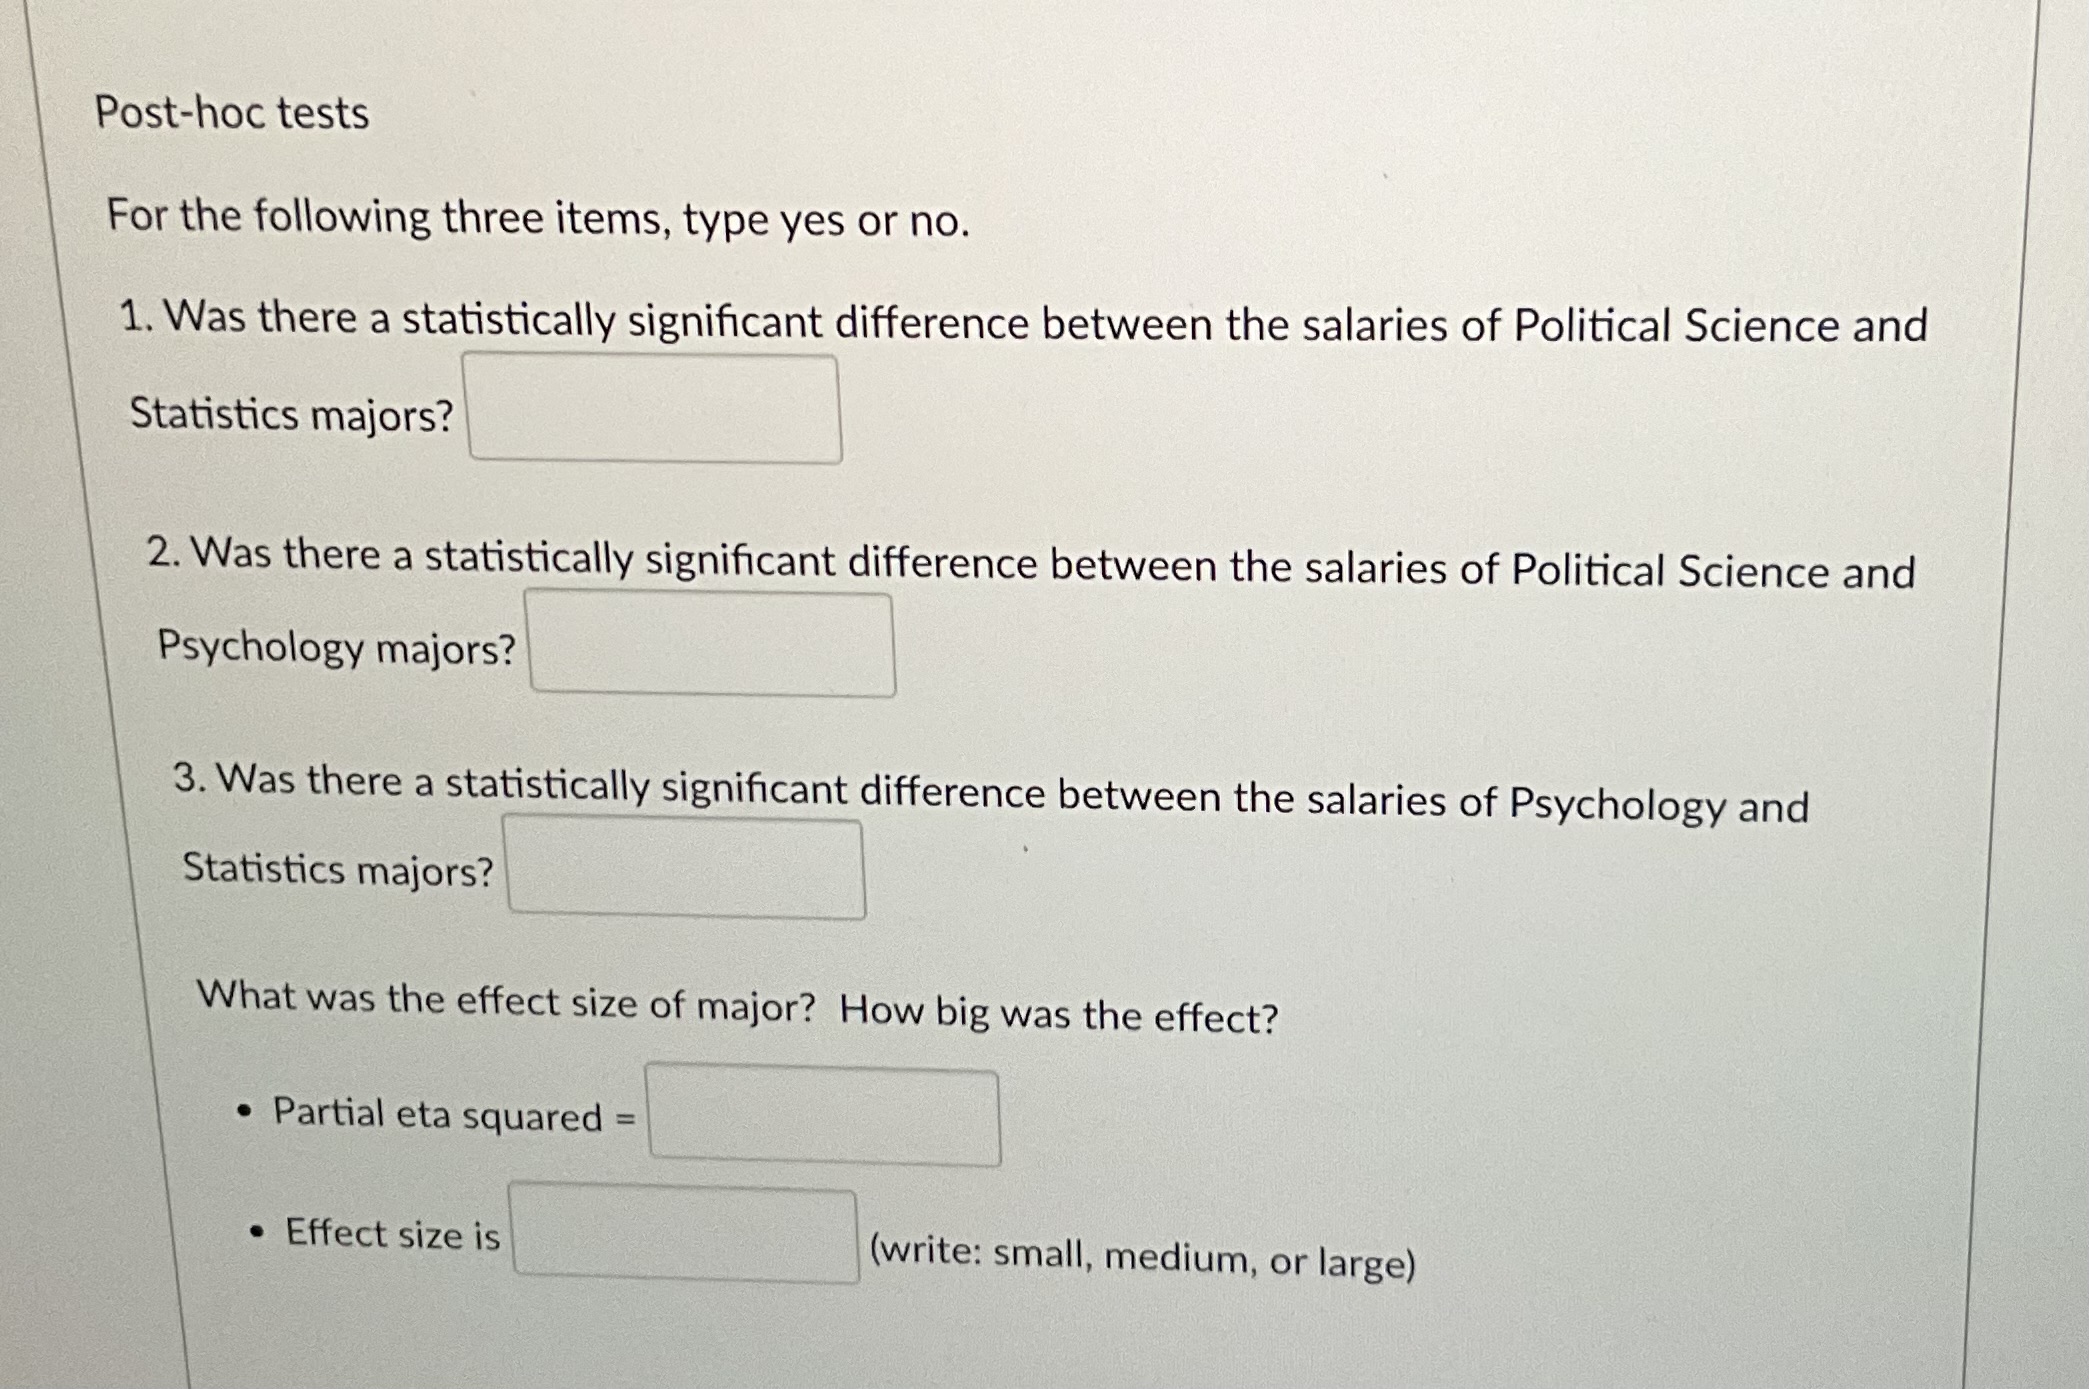
Statistics Political Science Psychology Bonferroni (Corrected a) Gender Male 78504.56 62612.78 73313.28 Male 76268.91 68325.06 69595.75 POST HOC TESTS 66657.85 56104.74 71163.33 Test P-value Sig? Male Male 78026.36 60966.45 67648.78 Poly v Stats Male 83485.22 55322.54 69036.39 Poly v Psych Male 70941.47 70799.21 71981.36 Psych v Stats Male 71752.44 61994.37 66776.50 Male 69551.77 59629.35 67306.72 Male 74773.13 62113.21 67783.51 Partial n squared = (SS effect)/(SS effect + SS within) Male 82245.84 66194.43 64641.76 Male 75745.72 59747.33 68031.53 Effect Size partial n squared partial n squared Male 76813.67 67324.75 66263.32 SS between/df Gender Male 80794.22 62633.90 66804.70 SS between/df Major Male 80810.78 59333.62 71901.94 Male 83562.41 60182.62 74186.58 Small 0.01 Male 86083.98 63669.61 66583.46 Medium 0.06 Male 71101.24 59055.83 65945.50 Large 0.14 Male 84664.49 64397.14 62478.61 . Male 80979.40 66246.08 79220.00 n-squared is the perdent of the variation in the DV that can be explained by the IV Male 82104.16 53666.52 80134.02 Female 71267.16 52472.16 73405.79 Female 79020.49 48200.11 65626.77 Female 75969.33 60562.26 71353.63 Female 69558.84 48181.16 67957.15 Female 68770.27 56007.93 68532.03 Female 76742.17 56366.43 78057.17 Female 79533.53 55461.77 61936.28 Female 73508.88 50789.84 61966.83 Female 80486.91 46596.92 63787.81 Female 77844.22 63388.90 70322.47 Female 73180.40 59036.75 59088.74 Female 76673.98 59009.46 61797.73 Female 73111.46 50096.93 66156.11 Female 67881.90 53542.09 70015.36 Female 78968.61 58358.33 58653.49 Female 75787.58 58183.74 62475.94 Female 72730.71 55866.24 70659.17 Female 69942.79 57824.97 73898.34 Female 66857.06 53457.98 66799.28 Female 73657.56 60431.17 61406.22\f\f\f\f\fInput the descriptive statistics requested into the table below regarding the main effect of the subject matter on salary. You can figure these out with the Excel formulas or the Descriptive Statistics function in Data> > Data Analysis. If you complete this manually, you will use the following functions: 1. =AVERAGE(range) 2. =STDEV(range) 3. =SKEW(range) 4. =KURT(range) Make sure you round to two decimal places, except for the n/N, which can be whole numbers. Also, make sure that if the number is a decimal, such as .02, you input a 0 before the decimal, 0.02 due to APA standards for these statistics. Then, answer the questions below. Just for your information, these tables are not in APA state due to Canvas constraints. M SD Skew Kurtosis Statistics Political Science Psychology What is the total sample size? N =Input the descriptive statistics requested into the table below regarding the main effect of gender in regard to salary. You can figure these out with the Excel formulas or the Descriptive Statistics function in Data> > Data Analysis. If you complete this manually, you will use the following functions: 1. =AVERAGE(range) 2. =STDEV(range) 3. =SKEW(range) 4. =KURT(range) Make sure you round to two decimal places, except for the n/N, which can be whole numbers. Also, make sure that if the number is a decimal, such as .02, you input a 0 before the decimal, 0.02 due to APA standards for these statistics. Then, answer the questions below. n M SD Skew Kurtosis Male FemaleThe previous tables created the descriptive statistics for the main effects of subject matter and gender regarding salary. Now, let's create one for the interaction between Gender and Subject Matter. This further divides the data into six groups. Males in Statistics, Females in Statistics, Males in Political Science, Females in Political Science, Males in Psychology, and Females in Psychology. You can figure these out with the Excel formulas or the Descriptive Statistics function in Data> > Data Analysis. If you complete this manually, you will use the following functions: 1. =AVERAGE(range) 2. =STDEV(range) 3. =SKEW(range) 4. =KURT(range) Make sure you round to two decimal places, except for the n/N, which can be whole numbers. Also, make sure that if the number is a decimal, such as .02, you input a 0 before the decimal, 0.02 due to APA standards for these statistics. Then, answer the questions below. MALE M SD Skew Kurt Statistics Political Science Psychology2. -STDEV(range) 3. " SKEW(range) 4. -KURT(range) Make sure you round to two decimal places, except for the n/N, which can be whole numbers. Also, make sure that if the number is a decimal, such as .02, you input a 0 before the decimal, 0.02 due to APA standards for these statistics. Then, answer the questions below. MALE M SD Skew Kurt Statistics Political Science Psychology FEMALE M SD Skew Kurt Statistics Political Science PsychologyHomogeneity of Variance When looking at homogeneity of variance between genders, F = When looking at homogeneity of variance between majors, F = , P= Therefore, the assumption of homogeneity of variance (write is or is not) met.Considering gender, it was found that there (write is OR is not) a main effect of gender. F( , P
Step by Step Solution
There are 3 Steps involved in it
Step: 1
Get Instant Access to Expert-Tailored Solutions
See step-by-step solutions with expert insights and AI powered tools for academic success
Step: 2
Step: 3
Ace Your Homework with AI
Get the answers you need in no time with our AI-driven, step-by-step assistance