Answered step by step
Verified Expert Solution
Link Copied!

Question

1 Approved Answer

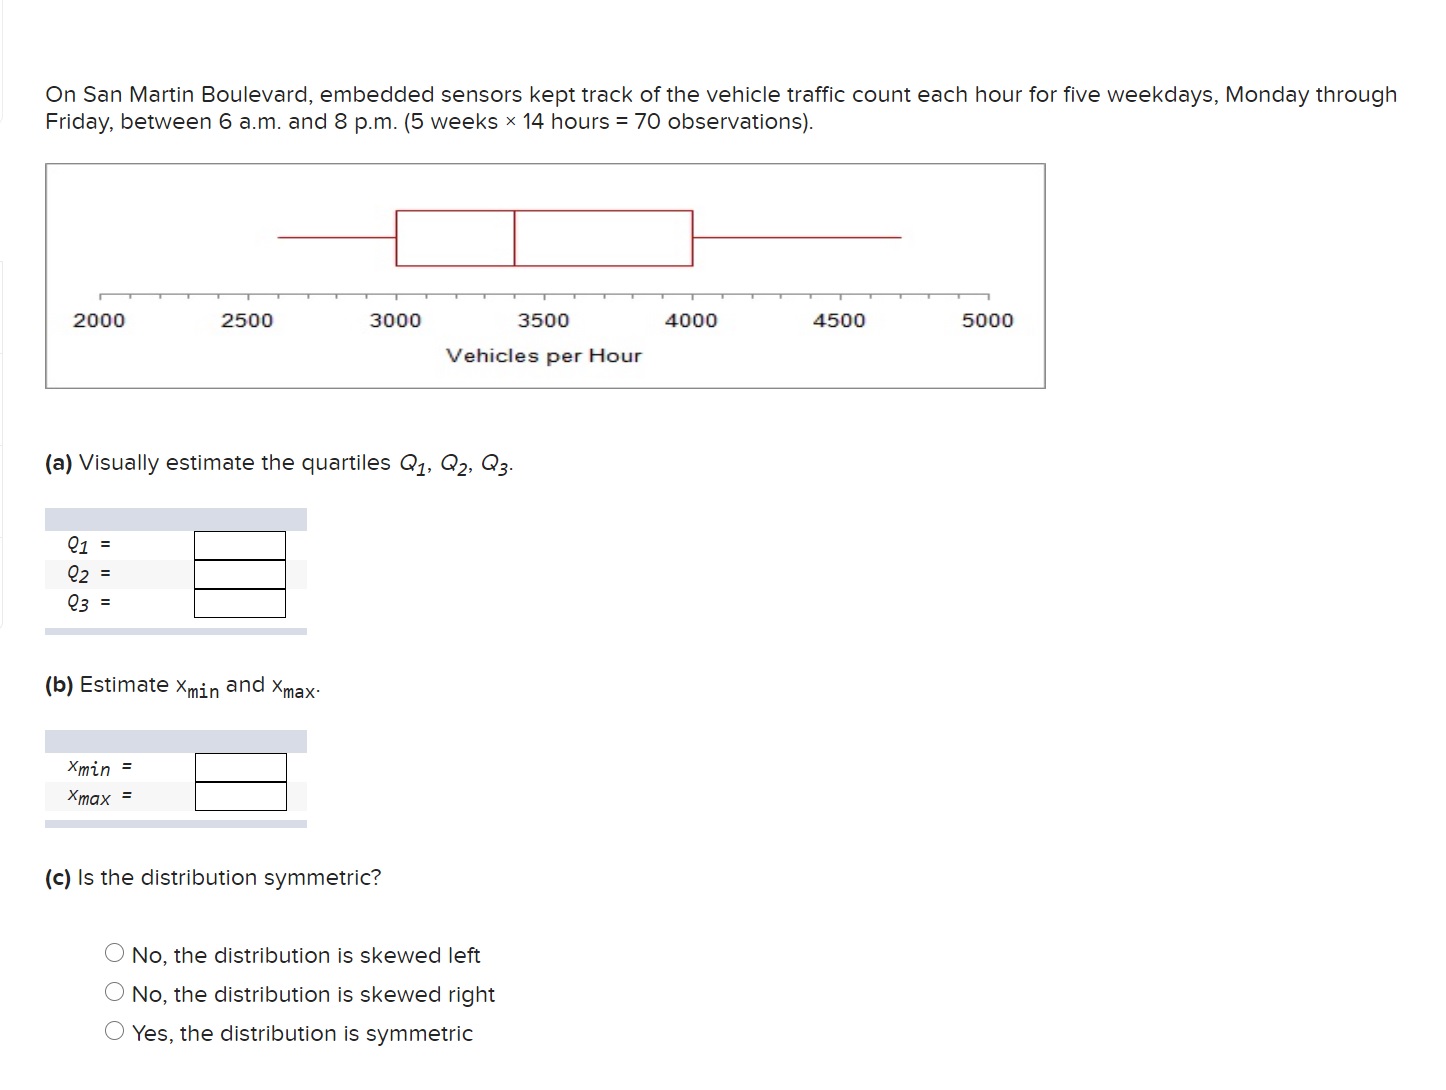
Hello can you please help me to answer this? On San Martin Boulevard, embedded sensors kept track of the vehicle traffic count each hour for

Hello can you please help me to answer this?

image text in transcribedimage text in transcribed
On San Martin Boulevard, embedded sensors kept track of the vehicle traffic count each hour for five weekdays, Monday through Friday, between 6 a.m. and 8 p.m. (5 weeks x 14 hours = 70 observations). 2000 2500 3000 3500 4000 4500 5000 Vehicles per Hour (a) Visually estimate the quartiles @1, @2, Q3. Q1 = Q2 = Q3 = (b) Estimate Xmin and Xmax. Xmin = Xmax = (c) Is the distribution symmetric? O No, the distribution is skewed left O No, the distribution is skewed right O Yes, the distribution is symmetricBelow are monthly rents paid by 30 students who live off campus. 596 596 596 796 566 456 556 896 666 486 586 526 426 666 516 526 716 775 466 486 626 556 576 365 596 666 686 766 586 636 Click here for the Excel Data File (3) Using Excel, nd the mean, median, mode, and standard deviation. (Round your answers to 2 decimal places.) Descriptive Statistics Data Mean Median Mode Standard Deviation (b) Which measure or measures of central tendency are most appropriate for this data set? 0 The mean or the median because these measures are close in value, which suggests the data set is fairly symmetric. O The median because the data set is strongly skewed. O The mode because the data is integer valued with a very small range. (c) Do the measures of central tendency agree? 0 No 0 Yes (e) Use Excel or MegaStat to sort and standardize the data. What is the z-score for the following rent vaiue? (Round your answer to 2 decimal places.) Rent value zscore 689 (f) Are there unusual data values? 0 Yes 0 No (9) Using the Empirical Rule, do you think the data could be from a normal population? ONO

Step by Step Solution

There are 3 Steps involved in it

Step: 1

blur-text-image

Get Instant Access to Expert-Tailored Solutions

See step-by-step solutions with expert insights and AI powered tools for academic success

Step: 2

blur-text-image

Step: 3

blur-text-image

Ace Your Homework with AI

Get the answers you need in no time with our AI-driven, step-by-step assistance

Get Started

Recommended Textbook for

Essentials of Business Analytics

Authors: Jeffrey D. Camm, James J. Cochran, Michael J. Fry, Jeffrey W. Ohlmann, David R. Anderson

2nd edition

1305627733, 978-1305861817, 1305861817, 978-0357688960, 978-1305627734

More Books

Students also viewed these Mathematics questions

Question

Explain the Neolithic age compared to the paleolithic age ?

Answered: 1 week ago

Question

What is loss of bone density and strength as ?

Answered: 1 week ago