Hello, can you tell me what your thoughts are on this? Thank you.
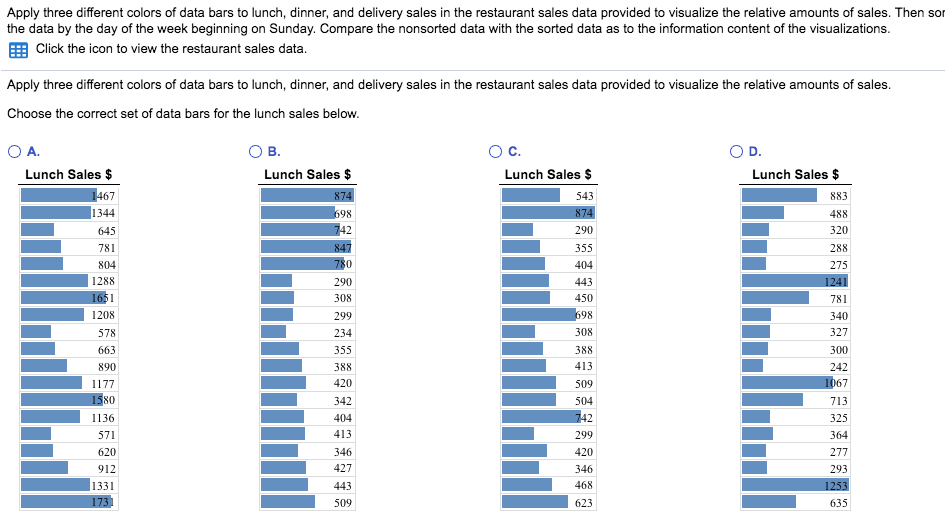
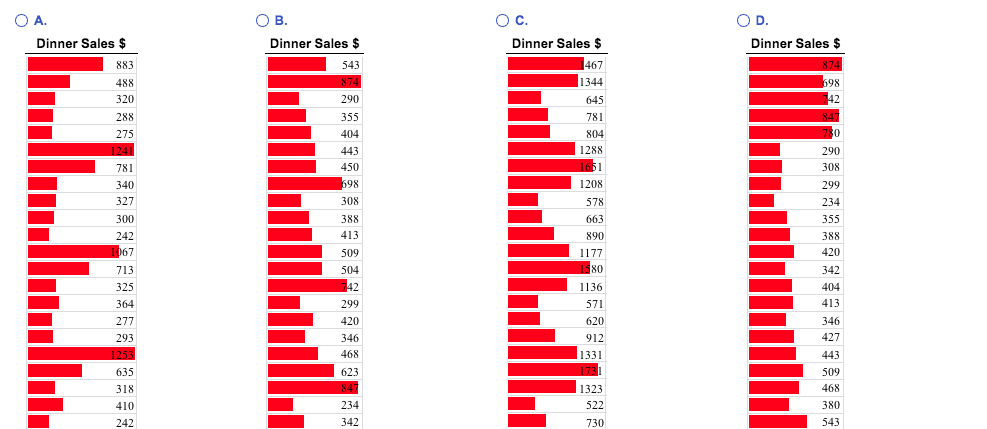
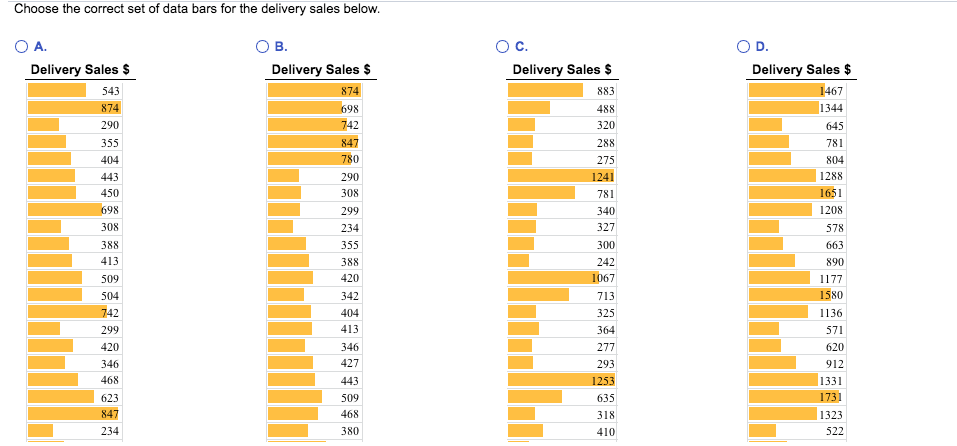
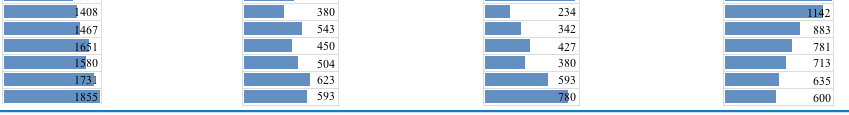
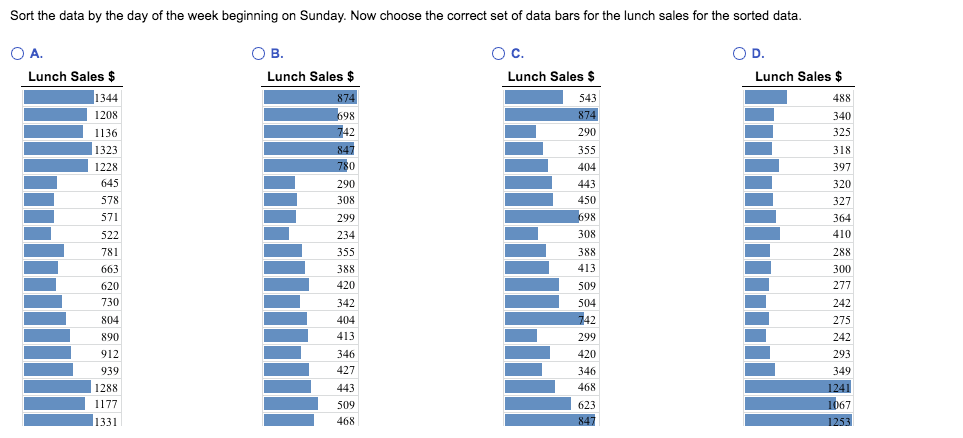
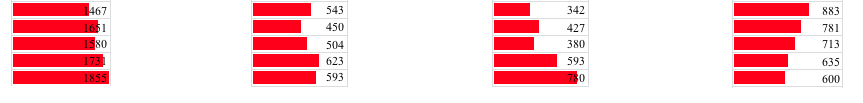
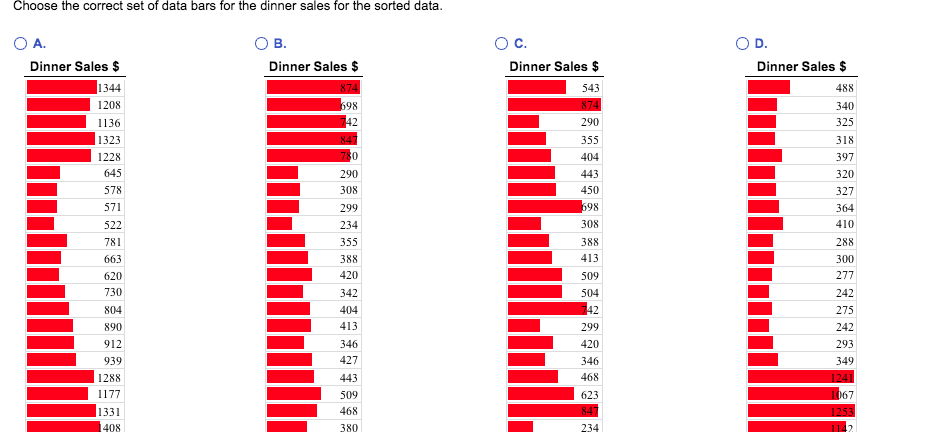
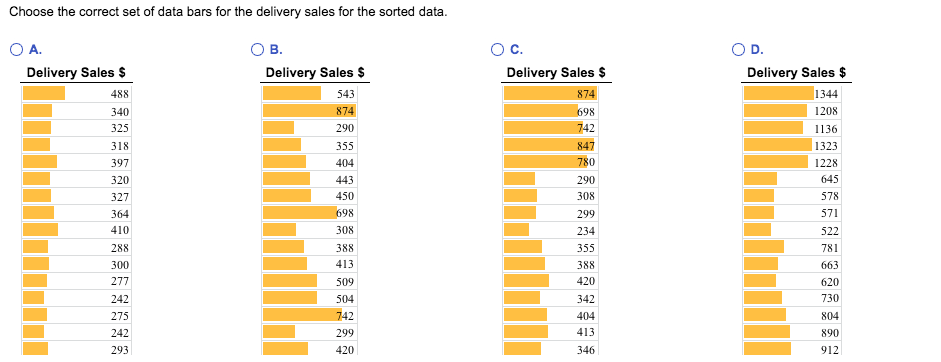
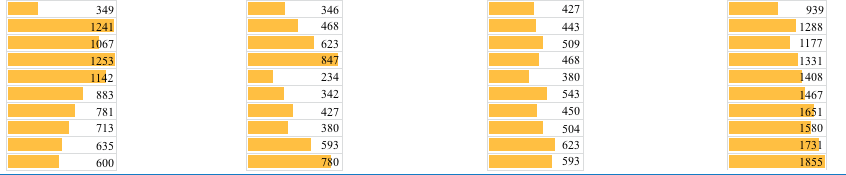
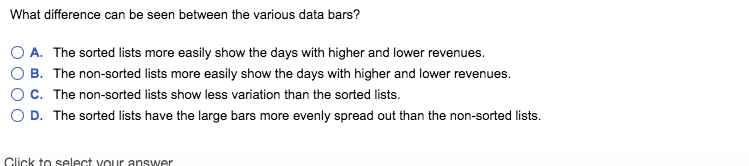
\fApply three different colors of data bars to lunch, dinner, and delivery sales in the restaurant sales data provided to visualize the relative amounts of sales. Then so the data by the day of the week beginning on Sunday. Compare the nonsorted data with the sorted data as to the information content of the visualizations. Click the icon to view the restaurant sales data. Apply three different colors of data bars to lunch, dinner, and delivery sales in the restaurant sales data provided to visualize the relative amounts of sales. Choose the correct set of data bars for the lunch sales below. O A. OB. O C. OD. Lunch Sales $ Lunch Sales $ Lunch Sales $ Lunch Sales $ 1467 874 543 883 1344 598 874 488 645 742 290 320 781 847 355 288 804 780 404 275 1288 290 443 1241 1651 308 450 781 1208 299 698 340 578 234 308 327 663 355 388 300 890 388 413 242 1177 420 509 1067 1580 342 504 713 1136 404 742 325 571 413 299 364 620 346 420 277 912 427 346 293 1331 443 468 1253 1731 509 623 635\f\f\fChoose the correct set of data bars for the delivery sales below. O A. OB. O C. OD. Delivery Sales $ Delivery Sales $ Delivery Sales $ Delivery Sales $ 543 874 883 1467 874 698 488 1344 290 742 320 645 355 847 288 781 404 780 275 804 443 290 1241 1288 450 308 781 1651 698 295 340 1208 308 234 327 578 388 355 300 663 413 388 242 890 509 420 1067 1177 504 342 713 1580 742 404 325 1136 299 413 364 571 420 346 277 620 346 427 293 912 468 443 1253 1331 623 509 635 173 847 468 318 1323 234 380 410 522\fSort the data by the day of the week beginning on Sunday. Now choose the correct set of data bars for the lunch sales for the sorted data. O A. OB. O C. OD. Lunch Sales $ Lunch Sales $ Lunch Sales $ Lunch Sales $ 1344 874 543 488 1208 698 874 340 1136 742 290 325 1323 847 355 318 1228 780 404 397 645 290 443 320 578 308 450 327 571 299 698 364 522 234 308 410 781 355 388 288 663 388 413 300 620 420 509 277 730 342 504 242 804 404 742 275 890 413 299 242 912 346 420 293 939 427 346 349 1288 443 468 1241 1177 509 623 1067 1331 468 847 1253\fChoose the correct set of data bars for the dinner sales for the sorted data. O A. OB. O C. OD Dinner Sales $ Dinner Sales $ Dinner Sales $ Dinner Sales $ 1344 874 543 488 1208 698 874 340 1136 742 290 325 1323 847 355 318 1228 780 404 397 645 290 443 320 578 308 450 327 571 299 698 364 522 234 308 410 781 355 388 288 663 388 413 300 620 420 509 277 730 342 504 242 804 404 42 275 890 413 299 242 912 346 420 293 939 427 346 349 1288 443 468 1241 1177 509 1067 1331 468 1253 408 380 234 1147Choose the correct set of data bars for the delivery sales for the sorted data. O A. OB. O c. OD. Delivery Sales $ Delivery Sales $ Delivery Sales $ Delivery Sales $ 488 543 874 1344 340 874 698 1208 325 290 742 1136 318 355 847 1323 397 404 780 1228 320 443 290 645 327 450 308 578 364 698 299 571 410 308 234 522 288 388 355 781 300 413 388 663 277 509 420 620 242 504 342 730 275 742 404 804 242 299 413 890 293 420 346 912\fWhat difference can be seen between the various data bars? O) A. The sorted lists more easily show the days with higher and lower revenues. O B. The non-sorted lists more easily show the days with higher and lower revenues. O C. The non-sorted lists show less variation than the sorted lists. O D. The sorted lists have the large bars more evenly spread out than the non-sorted lists. Click