Hello dear, can you help me with This?
I solved them, I just want to make sure I did the right or wrong
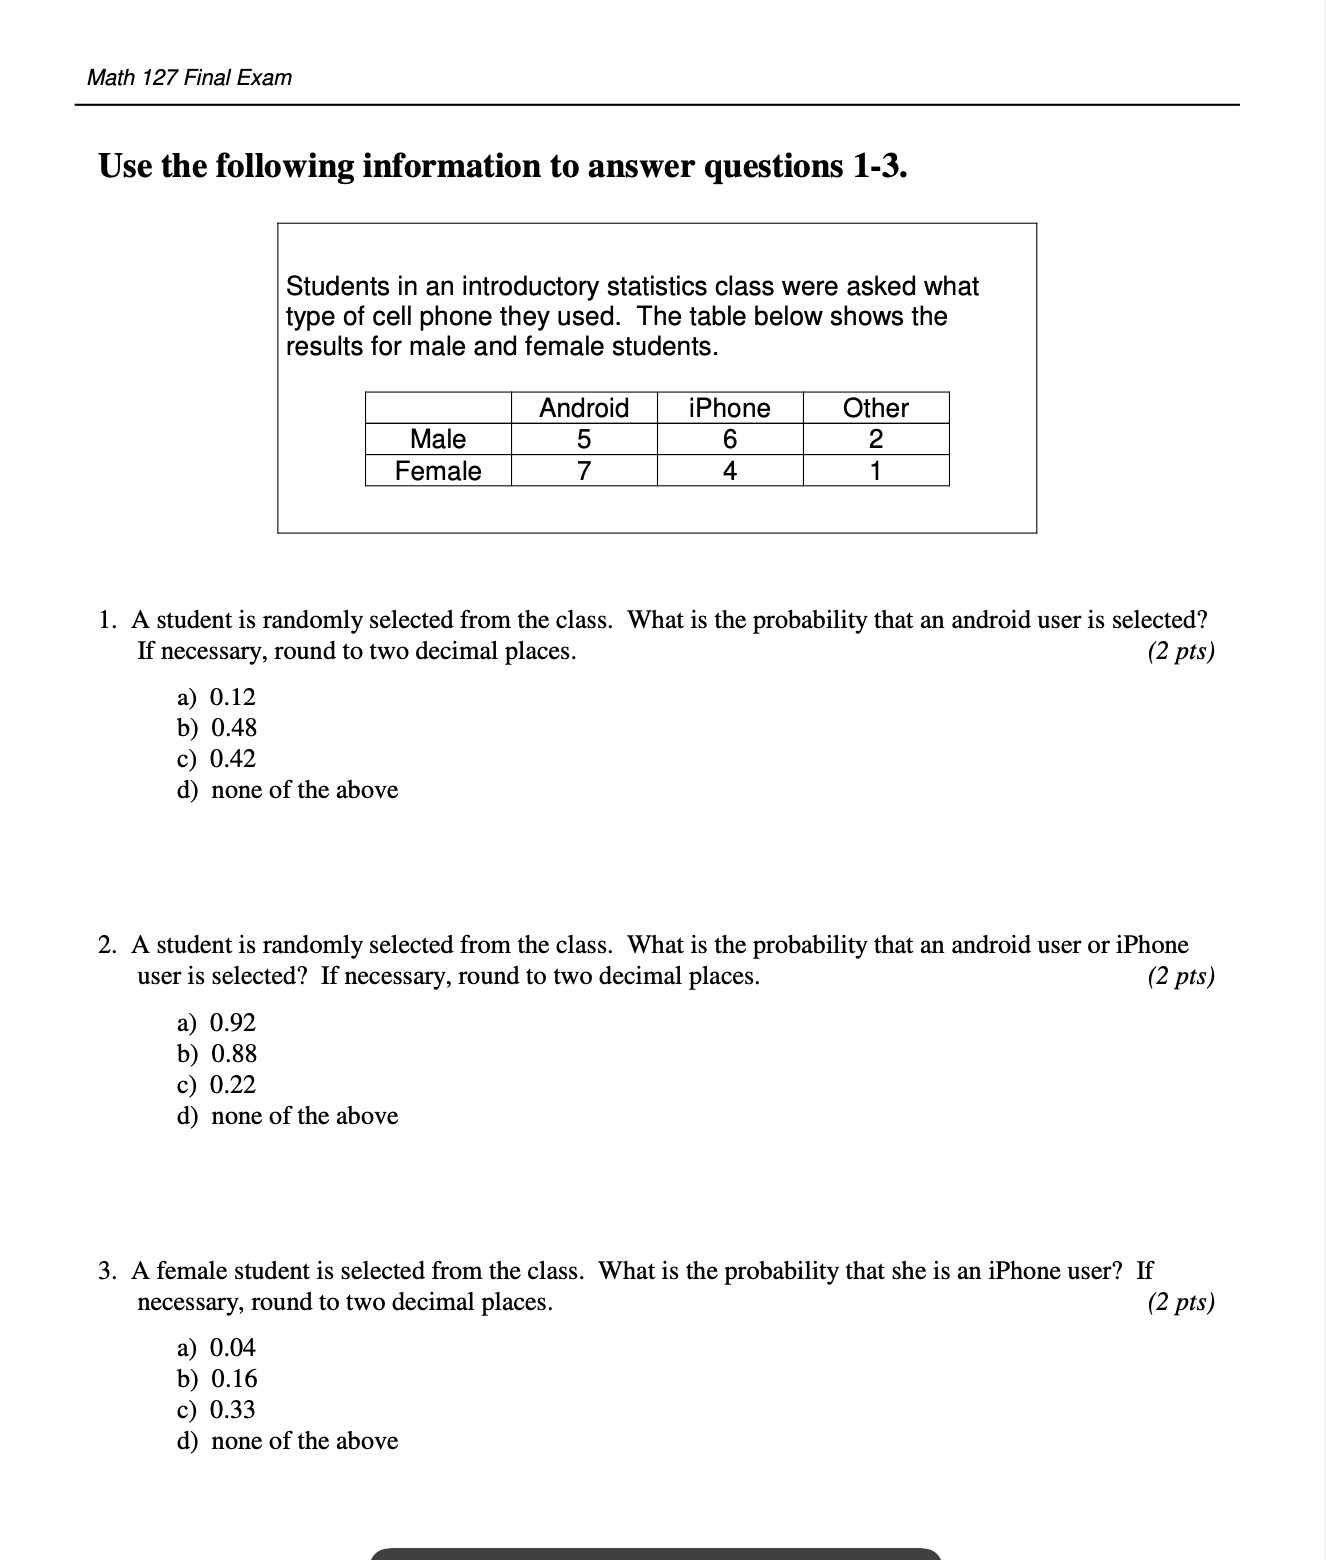
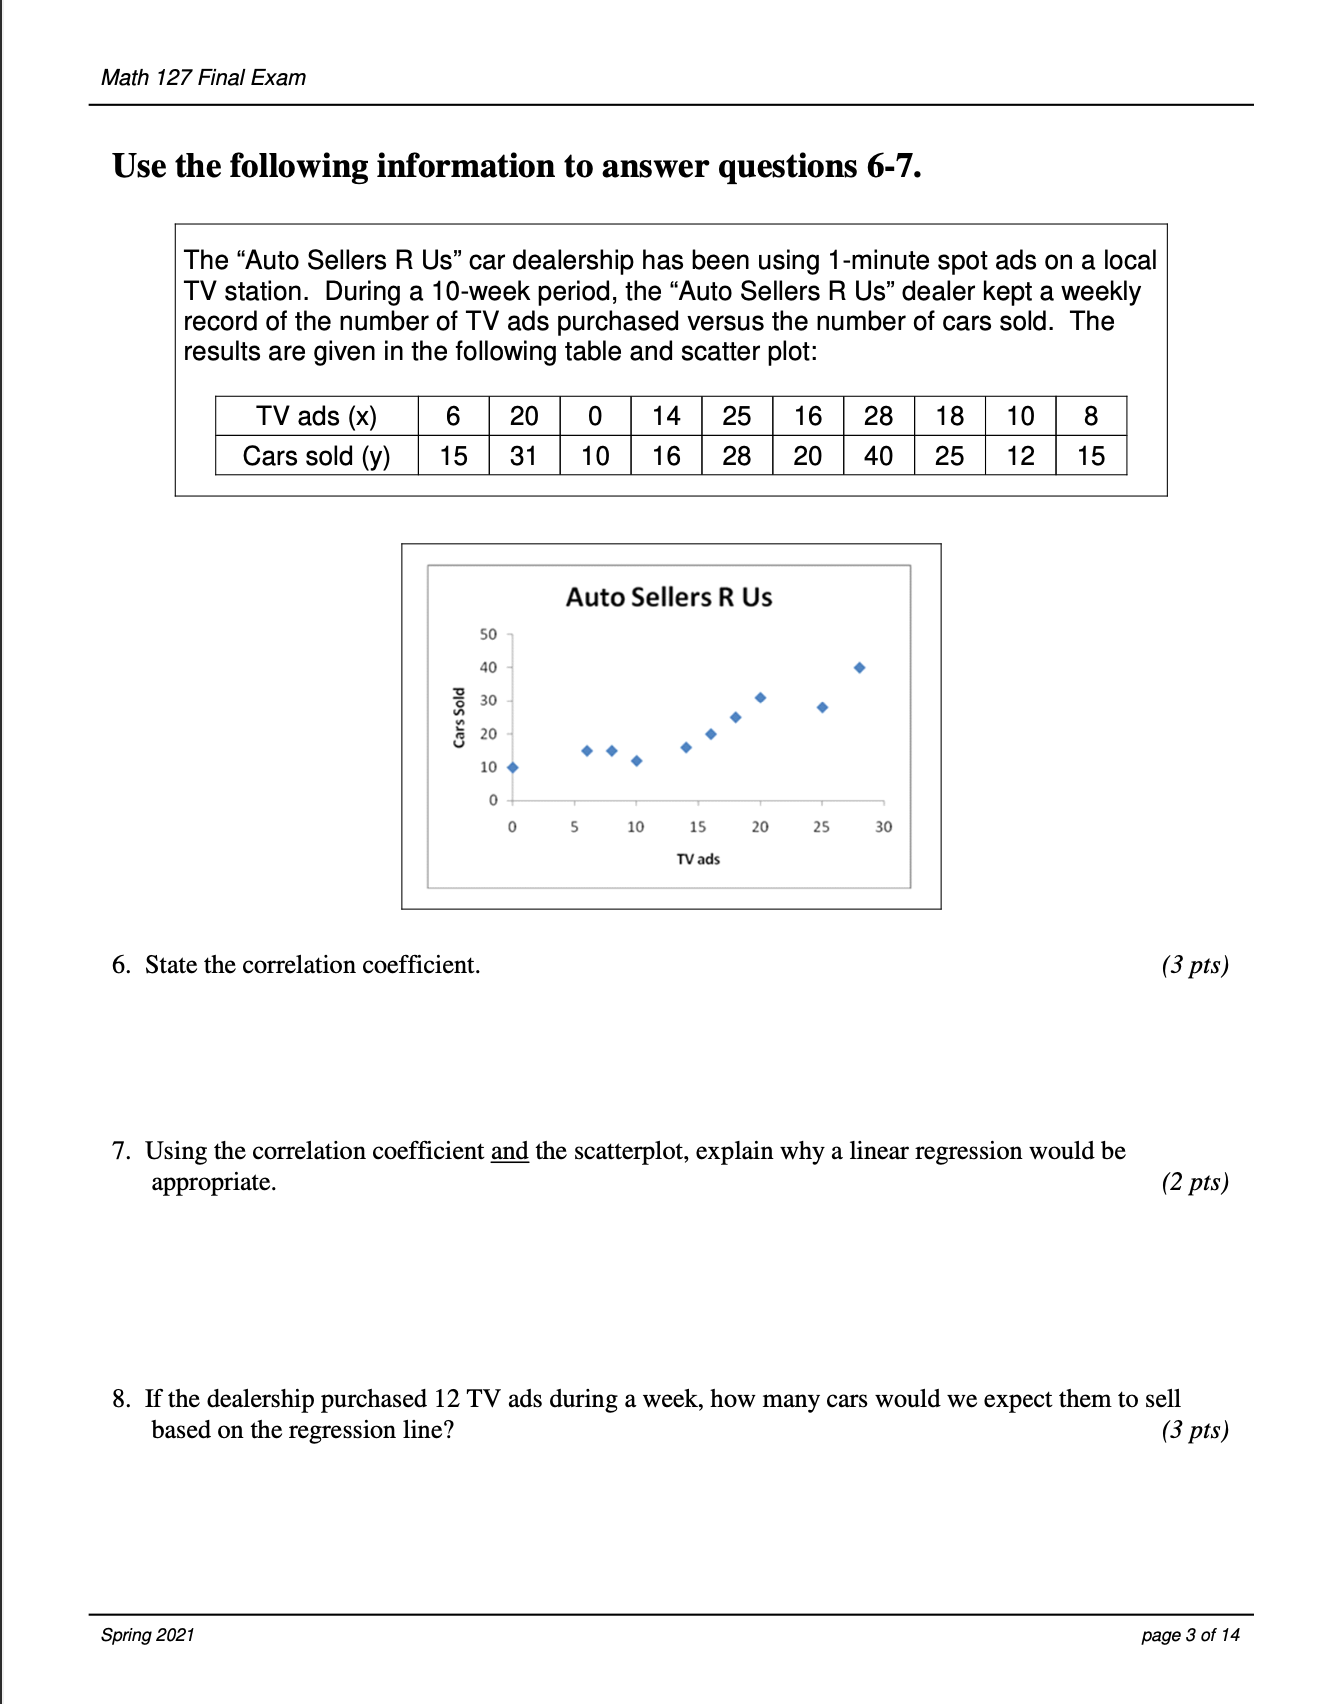
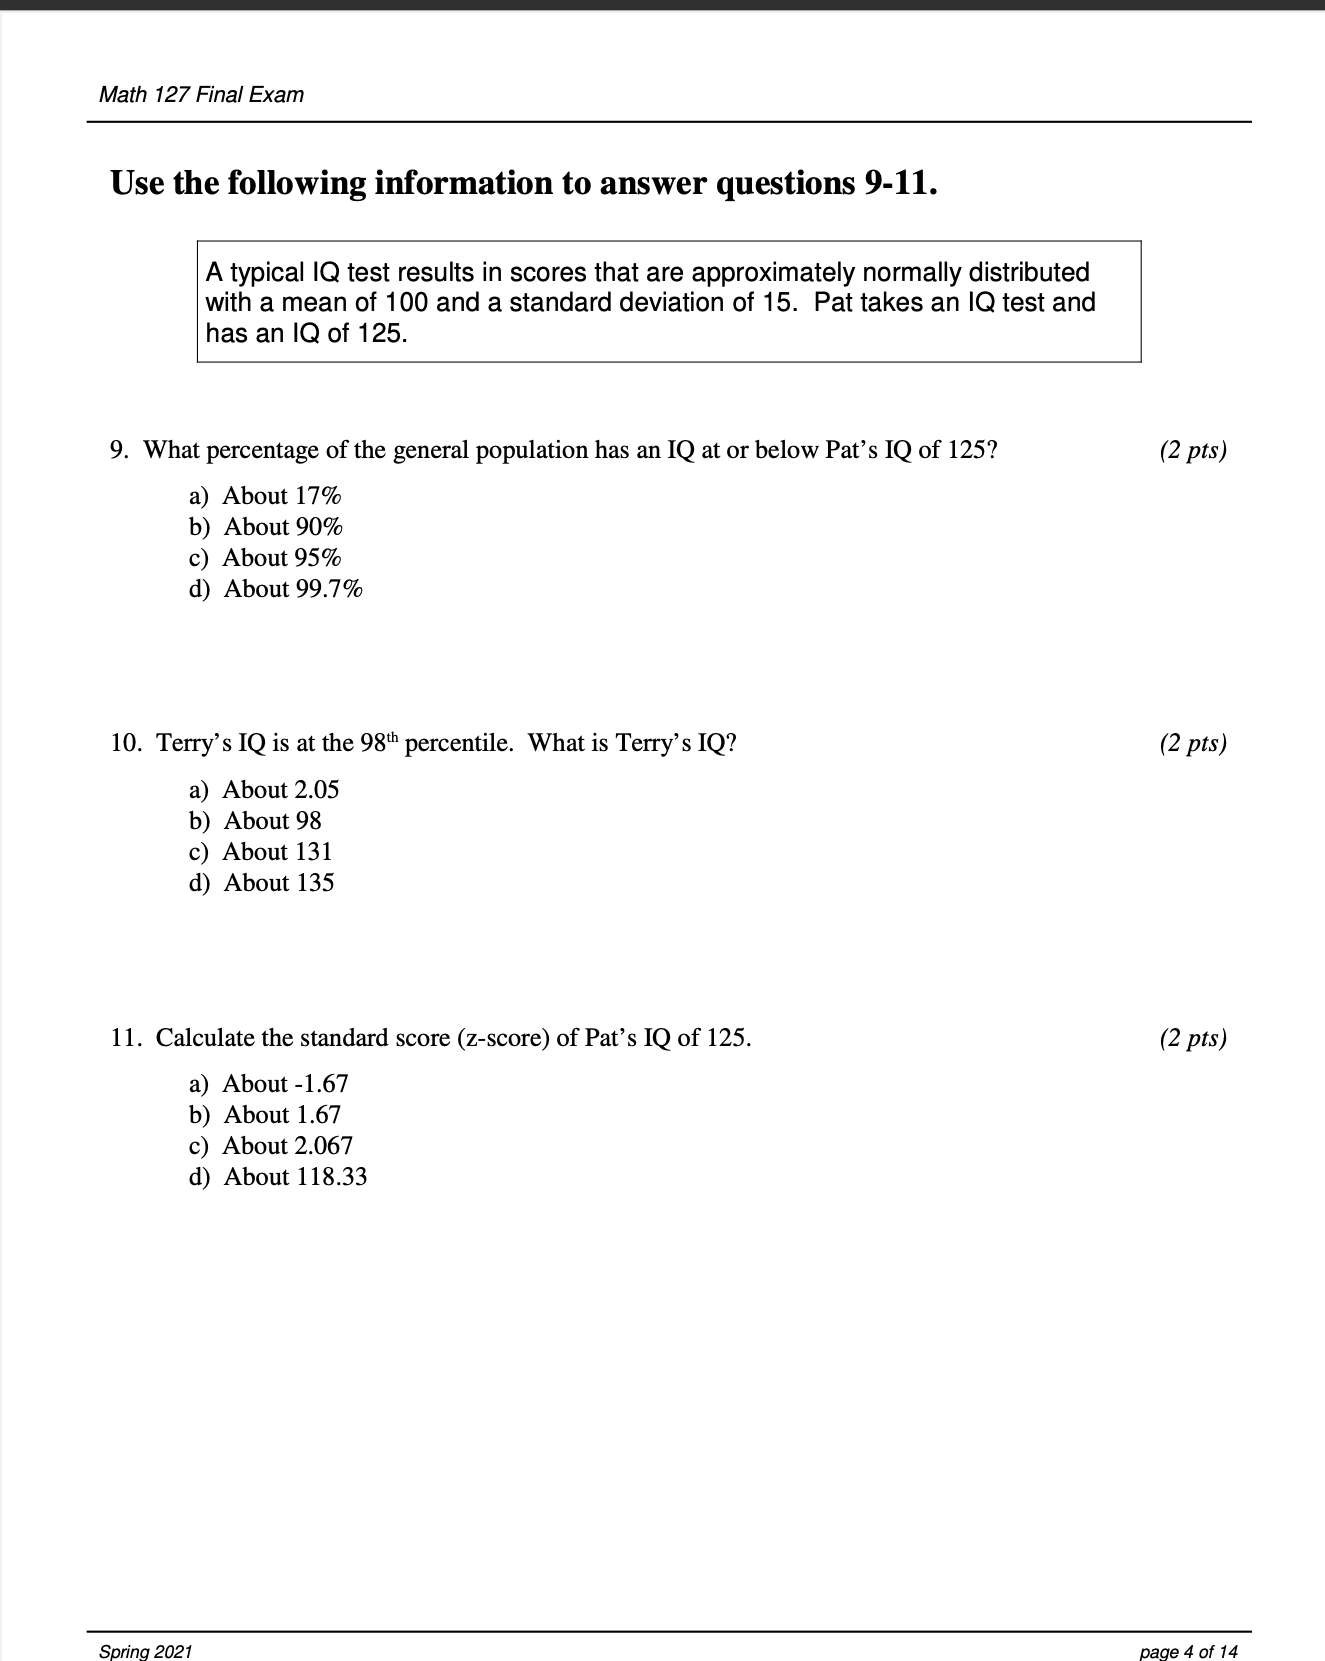
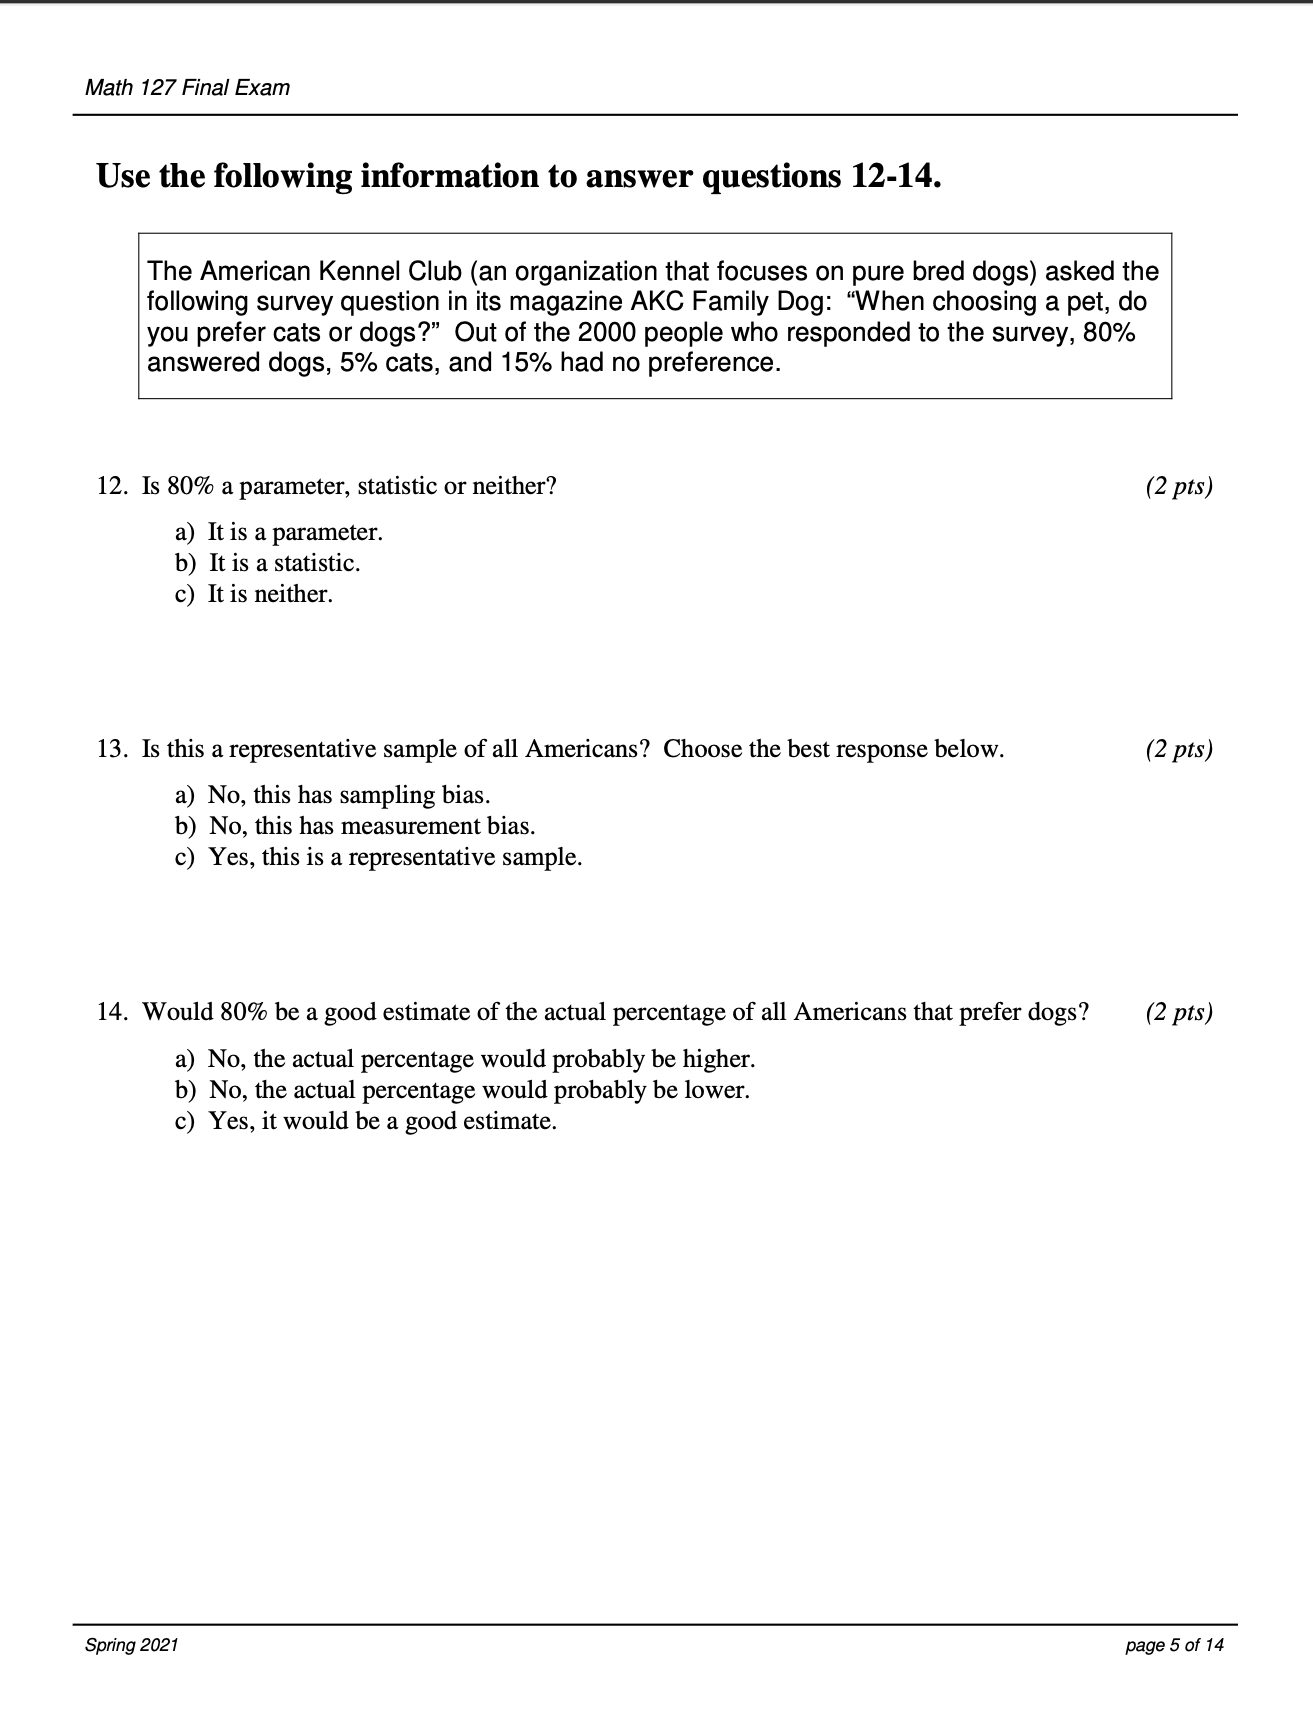
Math 127 Final Exam Use the following information to answer questions 1-3. Students in an introductory statistics class were asked what type of cell phone they used. The table below shows the results for male and female students. -sss- Male 5 6 2 Female 7 4 1 1. A student is randomly selected from the class. What is the probability that an android user is selected? If necessary, round to two decimal places. (2 pts) a) 0.12 b) 0.48 c) 0.42 d) none of the above 2. A student is randomly selected from the class. What is the probability that an android user or iPhone user is selected? If necessary, round to two decimal places. (2 pts) a) 0.92 b) 0.88 c) 0.22 d) none of the above 3. A female student is selected from the class. What is the probability that she is an iPhone user? If necessary, round to two decimal places. (2 pts) a) 0.04 b) 0.16 c) 0.33 d) none of the above Math 127 Final Exam Use the following information to answer questions 4-5. In order to update its front end labor scheduling program, a supermarket chain needed to find out the amount of time necessary to bag customer orders. The following bagging times (in minutes) were recorded for 25 customer orders. 0.09 0.13 0.14 0.17 0.18 0.19 0.26 0.26 0.32 0.42 0.48 0.54 0.59 0.75 0.77 0.82 0.86 0.86 1.05 1.11 1.12 1.63 2.08 3.04 4.87 4. Find the 5-number summary for the data. DO NOT ROUND. (4 pts) 5. Construct a "modified" box plot of the bagging times showing outliers. Label the axis and scale.(5 pts)Math 127 Final Exam Use the following information to answer questions 6-7. The "Auto Sellers R Us" car dealership has been using 1-minute spot ads on a local TV station. During a 10-week period, the "Auto Sellers R Us" dealer kept a weekly record of the number of TV ads purchased versus the number of cars sold. The results are given in the following table and scatter plot: TV ads (x) 6 20 0 14 25 16 28 18 10 8 Cars sold (y) 15 31 10 16 28 20 40 25 12 15 Auto Sellers R Us 50 40 30 Cars Sol 20 10 0 5 10 15 20 25 30 TV ads 6. State the correlation coefficient. (3 pts) 7. Using the correlation coefficient and the scatterplot, explain why a linear regression would be appropriate. (2 pts) 8. If the dealership purchased 12 TV ads during a week, how many cars would we expect them to sell based on the regression line? (3 pts) Spring 2021 bage 3 of 14Math 127 Final Exam Use the following information to answer questions 9-11. A typical IQ test results in scores that are approximately normally distributed with a mean of 100 and a standard deviation of 15. Pat takes an IQ test and has an IQ of 125. 9. What percentage of the general population has an IQ at or below Pat's IQ of 125? (2 pts) a) About 17% b) About 90% c) About 95% d) About 99.7% 10. Terry's IQ is at the 98th percentile. What is Terry's IQ? (2 pts) a) About 2.05 b) About 98 c) About 131 d) About 135 11. Calculate the standard score (z-score) of Pat's IQ of 125. (2 pts) a) About -1.67 b) About 1.67 c) About 2.067 d) About 118.33 Spring 2021 age 4 of 14Math 127 Final Exam Use the following information to answer questions 12-14. The American Kennel Club (an organization that focuses on pure bred dogs) asked the following survey question in its magazine AKC Family Dog: "When choosing a pet, do you prefer cats or dogs?" Out of the 2000 people who responded to the survey, 80% answered dogs, 5% cats, and 15% had no preference. 12. Is 80% a parameter, statistic or neither? (2 pts) a) It is a parameter. b) It is a statistic. c) It is neither. 13. Is this a representative sample of all Americans? Choose the best response below. (2 pts} a) No, this has sampling bias. b) No, this has measurement bias. 0) Yes, this is a representative sample. 14. Would 80% be a good estimate of the actual percentage of all Americans that prefer dogs? (2 pts) a) No, the actual percentage would probably be higher. b) No, the actual percentage w0u1d probably be lower. 0) Yes, it would be a good estimate. Spring 2021 page 5 of 14


