

Question
Hello Expert team please read my question carefully thank you !A psychologist has prepared an Optimism Test that is administered yearly to graduating College students.
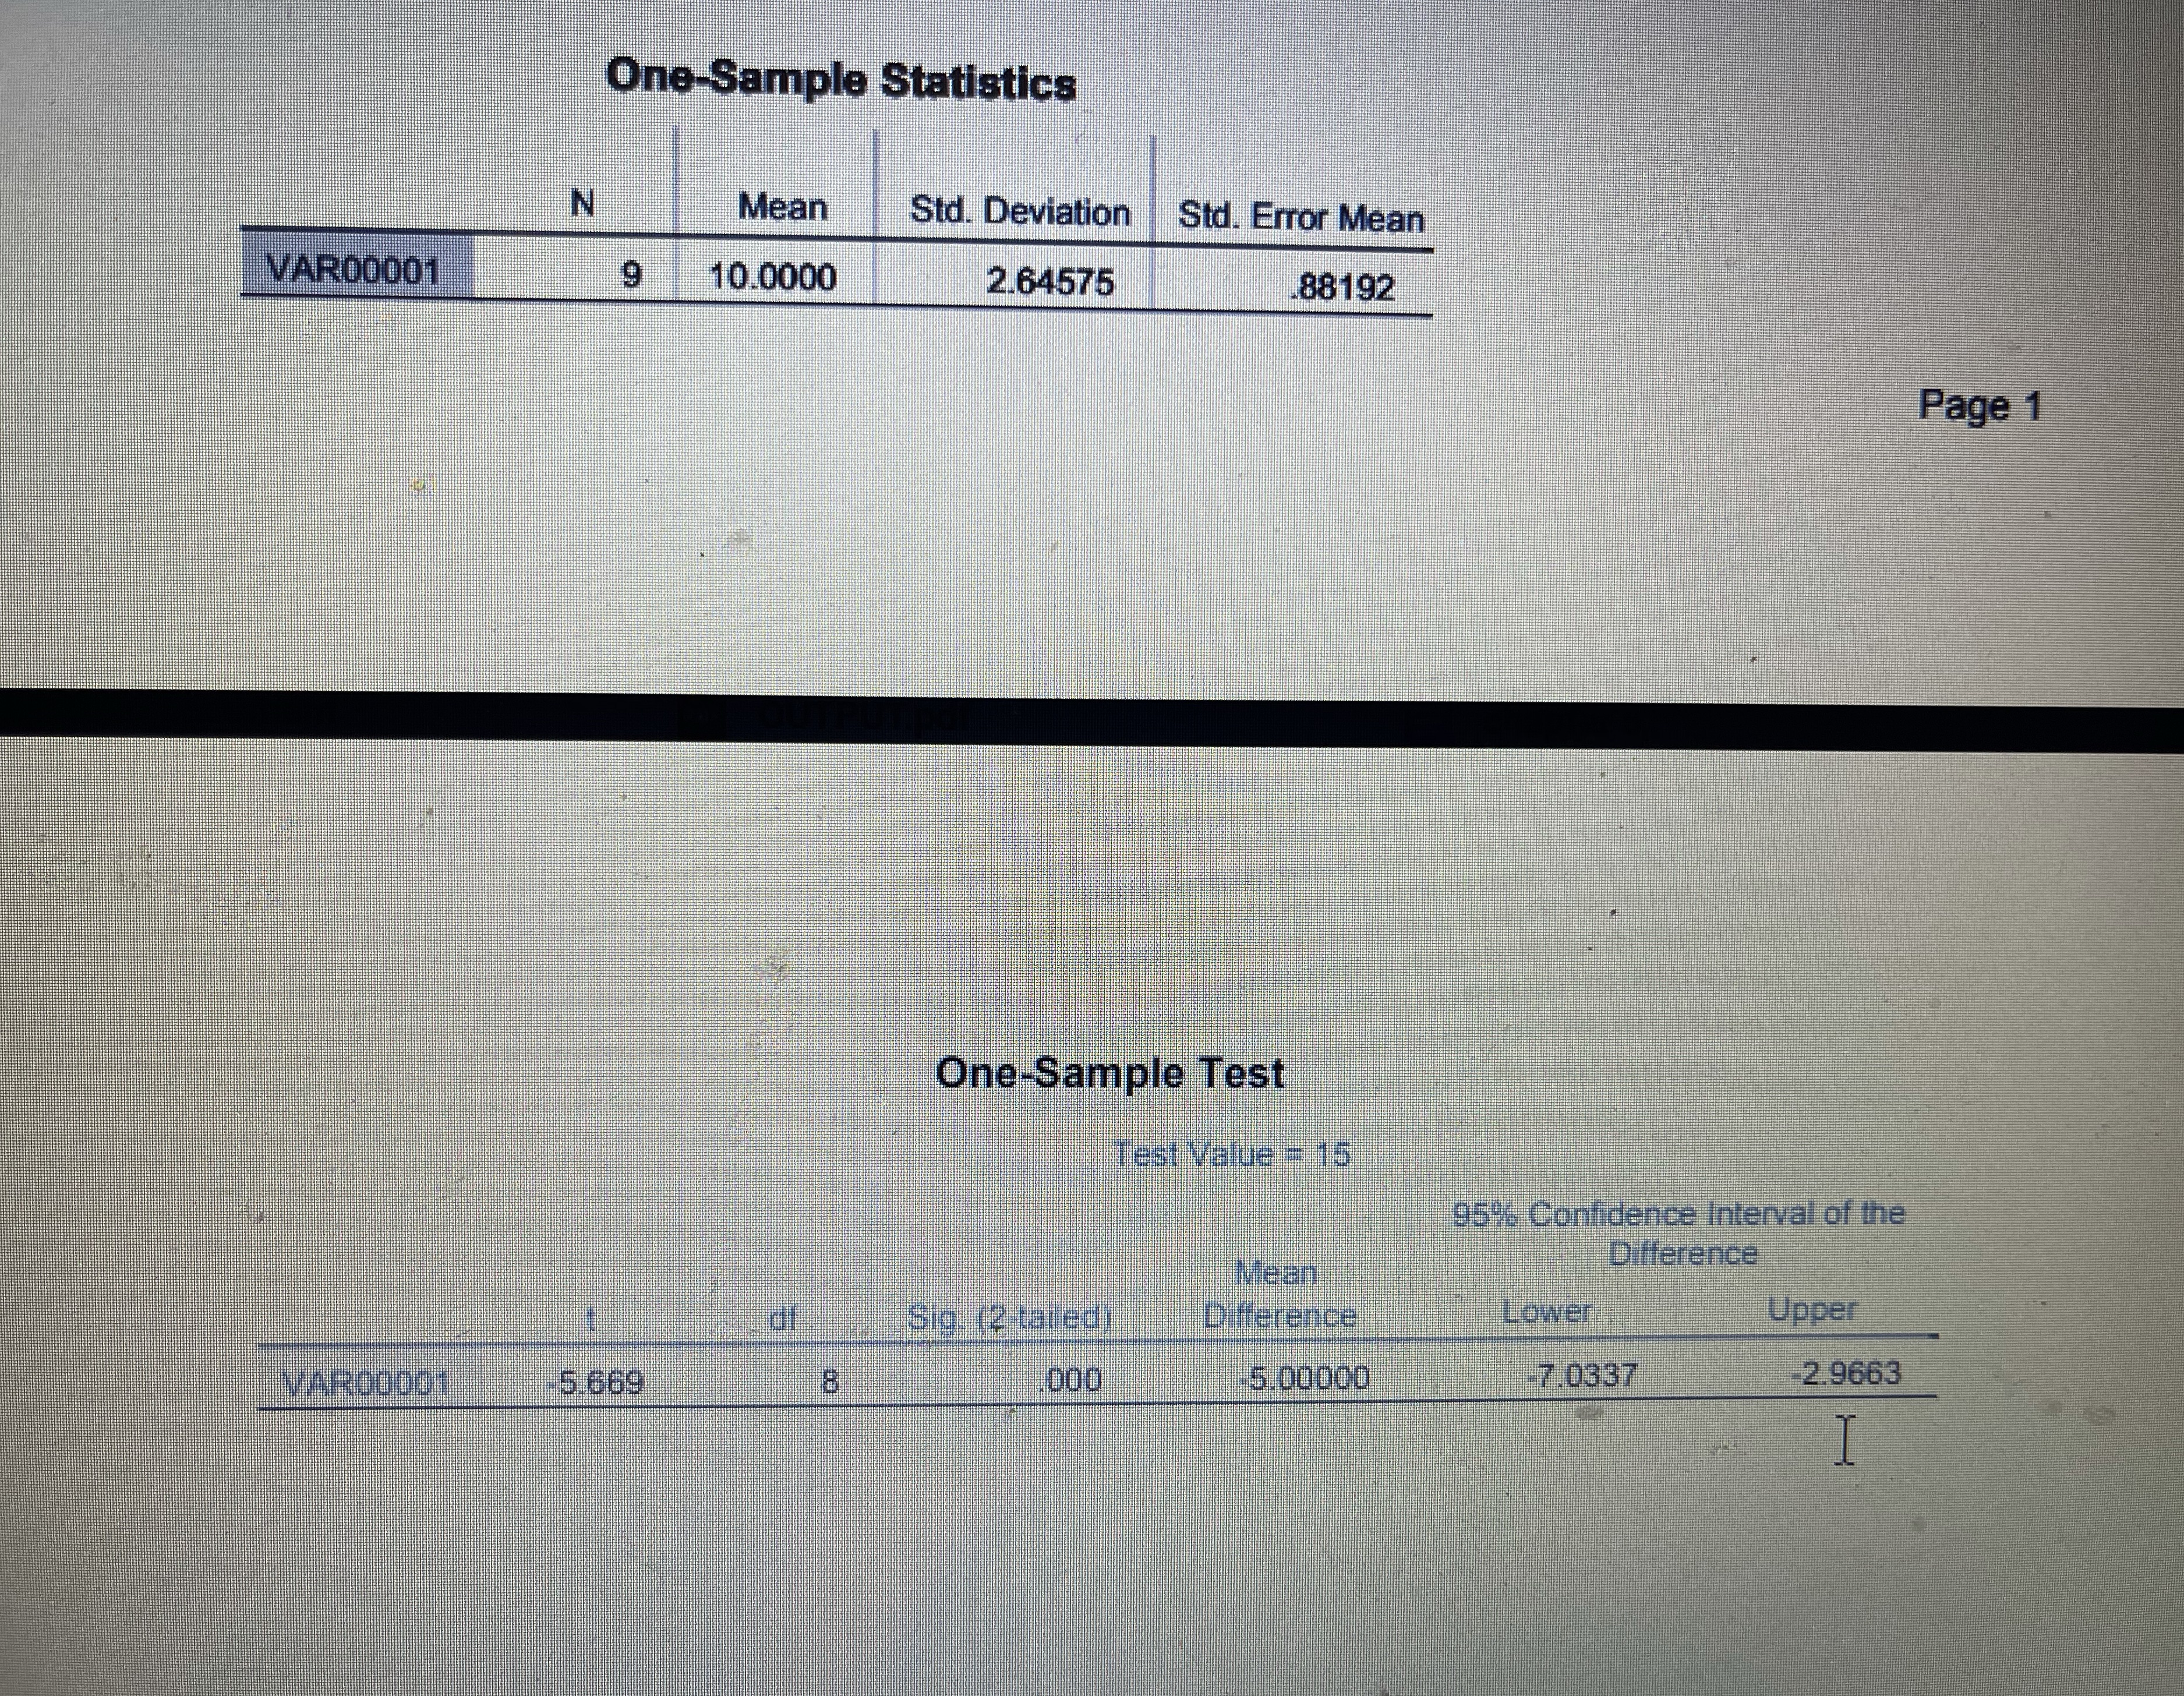
Hello Expert team please read my question carefully thank you !A psychologist has prepared an "Optimism Test" that is administered yearly to graduating College students. The test measures how each graduating class feels about its future?the higher the score, the more optimistic the class. Last year's class had a mean score of ? = 15. A sample of n = 9 graduating students from this year's class was selected and tested. The scores for these students are 8, 11, 10, 14, 7, 9, 14, 10, and 7. On the basis of this sample, can the psychologist conclude that this year's class has a different level of optimism than last year's class? Note that this hypothesis test will use a t statistic because the population variance (?2) is not known.The null hypothesis is the following H0: ? = 15The alternative hypothesis is the following H1: ? ? 15The image that I have attached is the result that we are supposed to generate from SPSS activity . And now the question is from that result we need to make a decision 1. Question #1: Based on your SPSS analysis output what decision will you make regarding the null hypothesis? Will you reject or retain it?2. Please use the example provided below to write the result. Please note that for this task you will not report the R2. See the following example:"We can conclude that there is a significant difference in level of optimism between this year's and last year's graduating classes, t(8)= -3.94, p
Step by Step Solution
There are 3 Steps involved in it
Step: 1

Get Instant Access to Expert-Tailored Solutions
See step-by-step solutions with expert insights and AI powered tools for academic success
Step: 2

Step: 3
Ace Your Homework with AI
Get the answers you need in no time with our AI-driven, step-by-step assistance
Get Started
Beginning Algebra A Text/Workbook
Authors: Charles P McKeague
2nd Edition
1483271242, 9781483271248