Hello, I already follow through up to the 5th point but I am confused because of the wordig of this question (I dont think that it is a simple percentage formula what it needs to be done, but some sort of a combination of a percentage and a comparison formula?) and because at the end of the instructions the teacher says that our work should look similar to the picture attached below. I can also send the worksheet I am currently working at, please have in mind that it should look like the picture in % not in change values. Please help
5. Calculate for each flavor the percent of total gallons Current this flavor represents compared with total sales for the current quarter of all flavors. Copy this formula to the adjacent column to calculate the percent of total gallons this flavor represents compared with historical total sales.
6. In the two adjacent columns, calculate for each flavor and for the totals the difference and percent difference in sales. Assume a positive value represents an increase in sales. Flavors without sales in the previous year should be left blank. (These cells should be completely empty.)
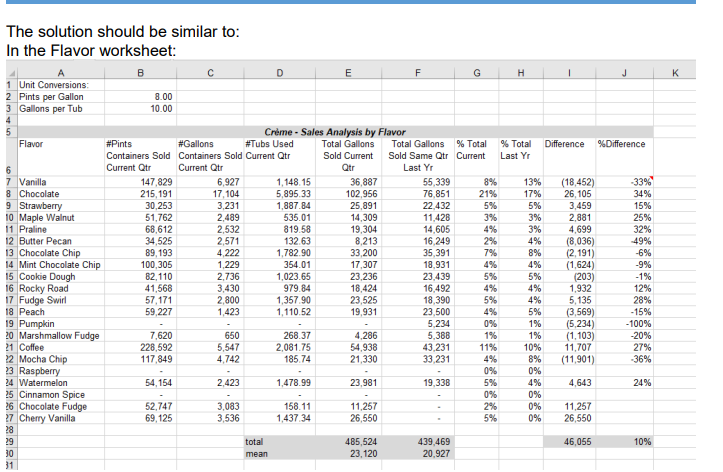
The solution should be similar to: In the Flavor worksheet: B D E F G H 1 Unit Conversions 2 Pints per Gallon 3 Gallons per Tub 8.00 10.00 Flavor Difference %Difference 6 7 Vanilla 8 Chocolate 9 Strawberry 10 Maple Walnut 11 Praline 12 Butter Pecan 13 Chocolate Chip 14 Mint Chocolate Chip 15 Cookie Dough 16 Rocky Road 17 Fudge Swirl 18 Peach 19 Pumpkin 20 Marshmallow Fudge 21 Coffee 2 Mocha Chip 23 Raspberry 24 Watermelon 25 Cinnamon Spice 26 Chocolate Fudge 27 Cherry Vanilla 28 29 30 31 Creme - Sales Analysis by Flavor #Pints #Gallons #Tubs Used Total Gallons Total Gallons % Total % Total Containers Sold Containers Sold Current Qtr Sold Current Sold Same Qtr Current Last Yr Current Qtr Current Otr Qtr Last Yr 147.829 6.927 1.148.15 36,887 55,339 8% 13% 215,191 17,104 5,895.33 102,956 76,851 21% 17% 30,253 3,231 1,887.84 25,891 22.432 5% 5% 51,762 2,489 535.01 14,309 11,428 3% 3% 68,612 2,532 819.58 19,304 14,605 4% 3% 34,525 2,571 132 63 8,213 16.249 2% 4% 89,193 4.222 1.782.90 33,200 35,391 7% 8% 100,305 1.229 354.01 17,307 18,931 4% 4% 82.110 2.736 1,023 65 23,236 23,439 5% 5% 41,568 3,430 979.84 18,424 16,492 4% 4% 57,171 2.800 1,357.90 23,525 18 390 5% 4% 59 227 1,423 1,110.52 19,931 23.500 4% 5% 5.234 0% 1% 7,620 650 268.37 4,286 5,388 1% 1% 228,592 5,547 2,081.75 54,938 43.231 11% 10% 117,849 4,742 185.74 21,330 33 231 8% 0% 0% 54,154 2,423 1,478.99 23,981 19.338 4% 0% 0% 52.747 3,083 158.11 11,257 0% 69,125 3,536 1,437 34 26,550 5% 0% (18,452) 26,105 3,459 2.881 4,699 (8,036) (2 191) (1.624) (203) 1,932 5,135 (3,569) (5.234) (1.103) 11,707 (11,901) -33% 34% 15% 25% 32% -49% -6% -9% -1% 12% 28% -15% -100% -20% 27% 36% 4% 5% 4.643 24% 2% 11,257 26,550 total 46,055 10% 485,524 23,120 439,469 20.927 mean The solution should be similar to: In the Flavor worksheet: B D E F G H 1 Unit Conversions 2 Pints per Gallon 3 Gallons per Tub 8.00 10.00 Flavor Difference %Difference 6 7 Vanilla 8 Chocolate 9 Strawberry 10 Maple Walnut 11 Praline 12 Butter Pecan 13 Chocolate Chip 14 Mint Chocolate Chip 15 Cookie Dough 16 Rocky Road 17 Fudge Swirl 18 Peach 19 Pumpkin 20 Marshmallow Fudge 21 Coffee 2 Mocha Chip 23 Raspberry 24 Watermelon 25 Cinnamon Spice 26 Chocolate Fudge 27 Cherry Vanilla 28 29 30 31 Creme - Sales Analysis by Flavor #Pints #Gallons #Tubs Used Total Gallons Total Gallons % Total % Total Containers Sold Containers Sold Current Qtr Sold Current Sold Same Qtr Current Last Yr Current Qtr Current Otr Qtr Last Yr 147.829 6.927 1.148.15 36,887 55,339 8% 13% 215,191 17,104 5,895.33 102,956 76,851 21% 17% 30,253 3,231 1,887.84 25,891 22.432 5% 5% 51,762 2,489 535.01 14,309 11,428 3% 3% 68,612 2,532 819.58 19,304 14,605 4% 3% 34,525 2,571 132 63 8,213 16.249 2% 4% 89,193 4.222 1.782.90 33,200 35,391 7% 8% 100,305 1.229 354.01 17,307 18,931 4% 4% 82.110 2.736 1,023 65 23,236 23,439 5% 5% 41,568 3,430 979.84 18,424 16,492 4% 4% 57,171 2.800 1,357.90 23,525 18 390 5% 4% 59 227 1,423 1,110.52 19,931 23.500 4% 5% 5.234 0% 1% 7,620 650 268.37 4,286 5,388 1% 1% 228,592 5,547 2,081.75 54,938 43.231 11% 10% 117,849 4,742 185.74 21,330 33 231 8% 0% 0% 54,154 2,423 1,478.99 23,981 19.338 4% 0% 0% 52.747 3,083 158.11 11,257 0% 69,125 3,536 1,437 34 26,550 5% 0% (18,452) 26,105 3,459 2.881 4,699 (8,036) (2 191) (1.624) (203) 1,932 5,135 (3,569) (5.234) (1.103) 11,707 (11,901) -33% 34% 15% 25% 32% -49% -6% -9% -1% 12% 28% -15% -100% -20% 27% 36% 4% 5% 4.643 24% 2% 11,257 26,550 total 46,055 10% 485,524 23,120 439,469 20.927 mean