

Question
Hello, I am a student new to Statistics and survey sampling. My project requires me to design the background and objectives of the project and
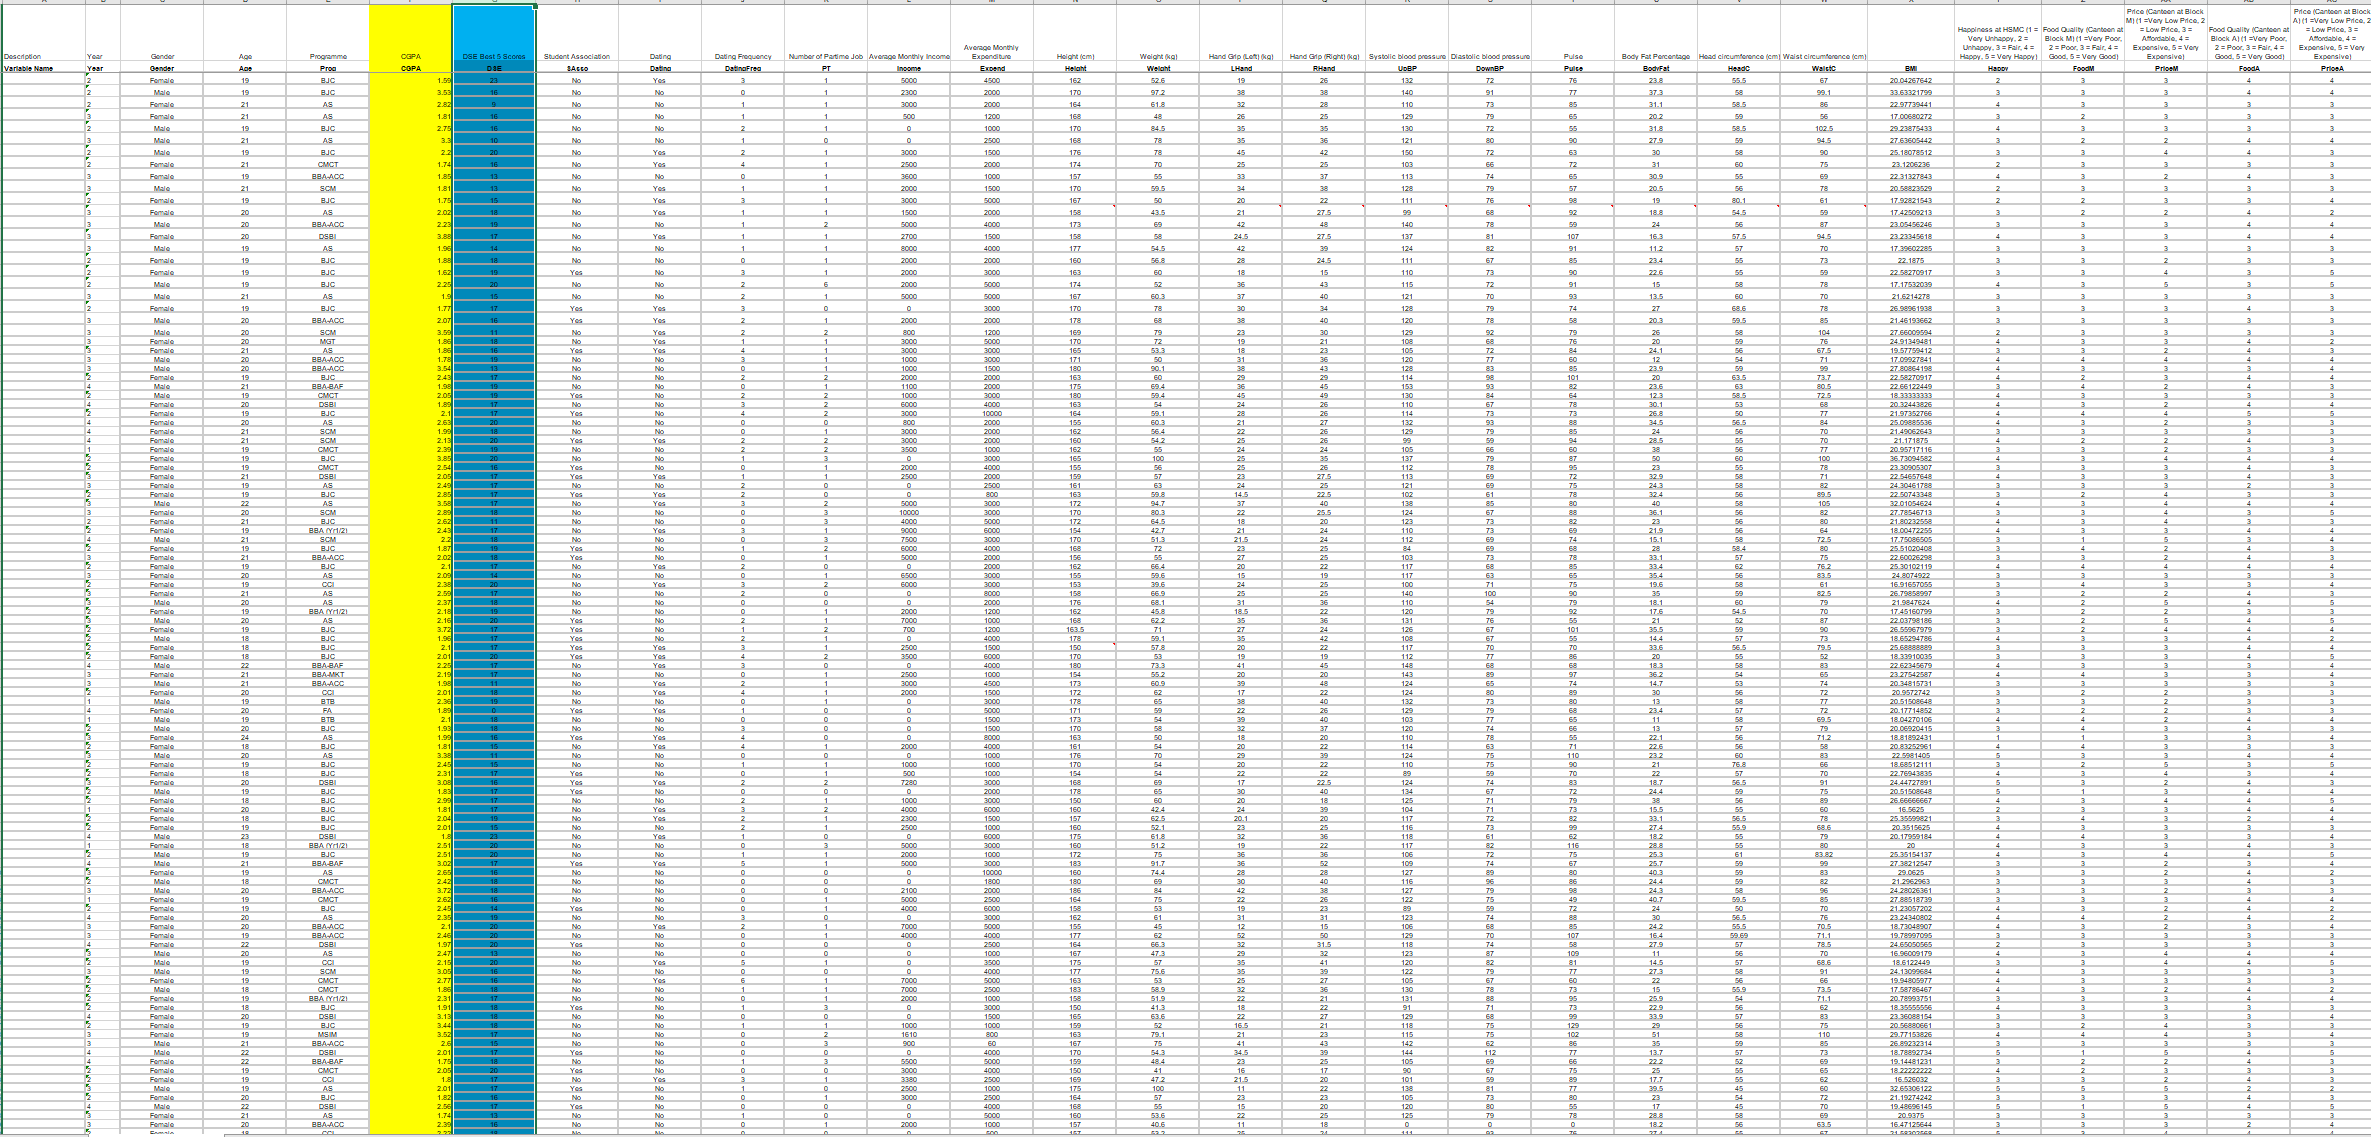
Hello, I am a student new to Statistics and survey sampling. My project requires me to design the background and objectives of the project and apply statistical methodologies to analyze the given excel dataset. The dataset, including a series of students information like gender, age, monthly income, height, etc.
Project Questions:Based on the given dataset from one of the Hong Kong Universities students surveys, students should design the background and objectives of the project. Students should apply statistical methodologies to analyze the given dataset. Calculations are expected to be completed with SPSS and the SPSS files should be submitted as well.
My designed objective: Find out the relationship between the CGPA (Cumulative Grade Point Average) and the DSE (Hong Kong Diploma of Secondary Education)
As I can't upload the whole dataset, I upload the screenshot of it, the yellow column is the CGPA, and the blue one is DSE
My questions about this project: any statistical methodologies to find out the relationship and help me to analyze it?How to do it ? I am not looking for the answers of this project, I just want to learn the way to do it , or the methods
Step by Step Solution
There are 3 Steps involved in it
Step: 1

Get Instant Access to Expert-Tailored Solutions
See step-by-step solutions with expert insights and AI powered tools for academic success
Step: 2

Step: 3
Ace Your Homework with AI
Get the answers you need in no time with our AI-driven, step-by-step assistance
Get Started
Intro Stats
Authors: Richard D. De Veaux, Paul F. Velleman, David E. Bock
3rd edition
321533283, 321533289, 9780321463708, 9780321503848, 9780321503800, 9780321499431, 9780321499417, 978-0321500458