

Answered step by step
Verified Expert Solution
Question
1 Approved Answer
Hello I am doing a Excel assignment for my class, and wanted to see if i could get some help with the assignment as soon
Hello I am doing a Excel assignment for my class, and wanted to see if i could get some help with the assignment as soon as possible. I am wishing to hear back from someone by 4pm today if possible, the assignment is displayed right below thanks again.
Excel Essentials Assignment -
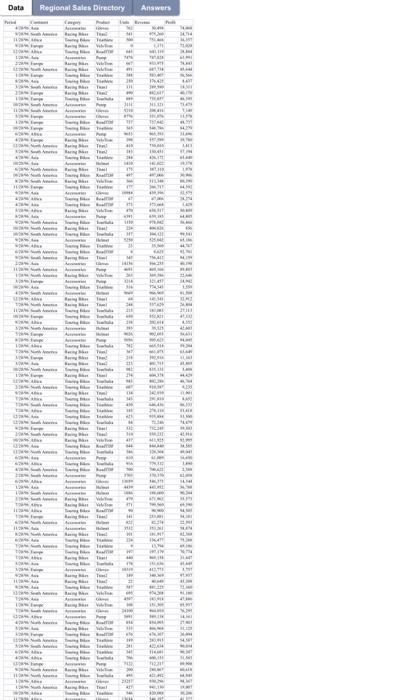
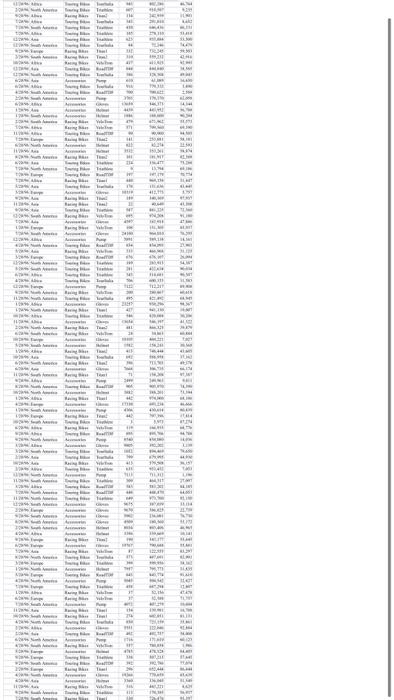
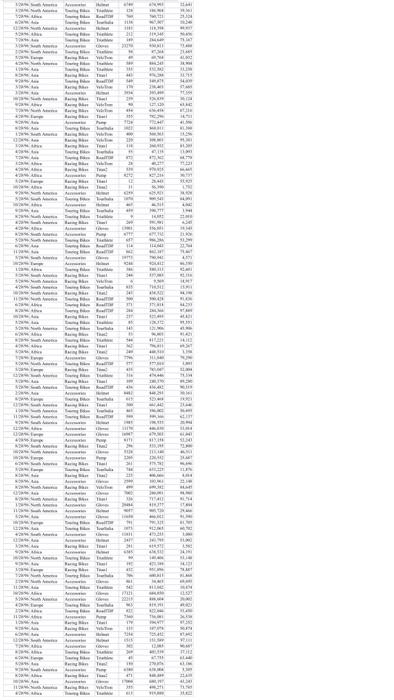
Instructions: To answer the questions on this assignment, you will need to use Microsoft Excel to analyze the data found in bikedata Essentials Project.xlsx. This project has been designed to give you exposure to a variety of excel functions that are widely considered to be necessary as a business professional. You will need to apply any number of functions and techniques. You are encouraged to learn as many shortcut keys as possible as you work through the tasks below. If you are already familiar with excel this should be a relatively easy assignment. If you are not familiar with the functions you are asked to utilize, search online FIRST to find the answer for how to accomplish something. One of the skills you will need in your professional life is problem solving and the ability to answer your own questions! If you still need help, you are then welcome to ask me. Note: If you are familiar with Pivot tables, you will be tempted to use them to answer the questions below. Do not use Pivot tables in this assignment, instead use the tools and functions indicated in the directions.
The data provided gives details about sales in a firm that specializing in bikes and accessories. Use the below steps to familiarize yourself with the data. As you work through the steps below, put your answer in the provided answer sheet of the workbook. NOTE: When pasting graphs, always paste as an image.
Make a copy of the data in a new sheet. (Protip: learn the shortcut) Name the new sheet Working Data.
One the new sheet, calculate the profit per unit and the unit sales price using formulas in two new columns. Label your columns appropriately!
1. Identify where you have a data error in the data by specifying the month, continent, category and product with the error in the answer sheet. (Copy or retype the data, do not use a cell reference.)
2. What is the error? Describe what steps you might take to deal with the error in your data if this were a work situation.
Apply filters to the dataset and use the filters to determine: 3. What are the Continents where products are sold? 4. What categories of products are sold?
5. Which products are classified as Accessories?
Use the filters to show only the rows that are in the Racing Bikes and copy these rows to a new worksheet. Rename this worksheet Racing Bike Analysis
1
MIS 301: Excel Essentials Assignment
6. How many rows are dedicated to Racing Bikes in the total data set?
On the Racing Bike Analysis tab, create a summary table next to the data that shows the number of rows of data per type of product sold, the number of units sold for that product and the total revenue per product. HINT: use countif and sumif functions to create the data in the table. GA Pro-Tip - Video: Simple summary tables
ROW COUNT: total number of rows of monthly sales per product, format general
UNITS: total number of units of each product sold, format as comma style with no decimal places.
REVENUE: total revenue per product, format as Accounting
7. Create a graph to show the comparative amount of revenue per product in the Racing bike category. Use the pie chart option and give it a meaningful name. Add data labels
to the chart and apply a new style for an improved look. Put the chart on the answer tab
(remember to copy and paste as an image.)
8. Create a second chart to show the amount of units sold per product. Before creating the
chart, sort the items so they are in order from the most units sold to the least. Display this information in a bar chart with a meaningful name. Change the style for the bar chart to have a grey background. Put the chart on the answer tab (remember to copy and paste as an image.)
Where are products sold by the firm? Copy the data to a new worksheet and name it Geographic Analysis. Create a summary table that includes the continent name, number of units sold and total profit for each continent.
9. Sort the table by total profit from largest to smallest. Which continent has the largest total profit?
10. Apply conditional formatting to the units column in the table so that it will highlight any continent with less than 280,000 units sold. Which continent falls below the desired units sold and ends up highlighted?
11. Create a clustered column graph that shows the total profit by continent. . Add data labels to the chart and apply a style with a black background to make it stand out. Put the chart on the answer tab (remember to copy and paste as an image.)
Assign regional sales person names to all rows in the data. Since this historical data did not include the current regional sales person name you need to assign it to each row. Use the
MIS 301: Excel Essentials Assignment
2
vlookup function in excel to pair the provided Regional Sales Directory data with the data provided to you on your working data tab. Name the new column that is created regional sales rep.
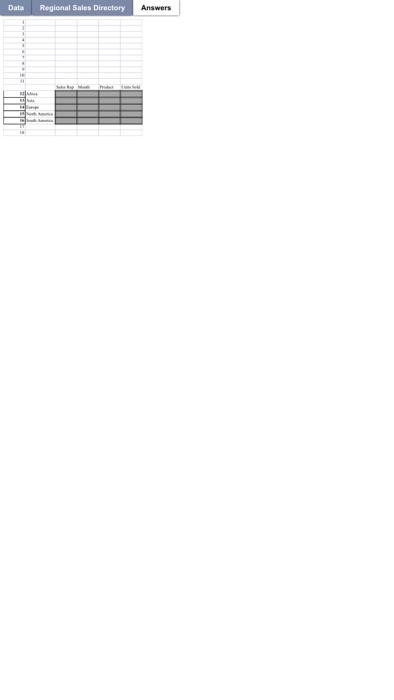
Sort the data on the working data tab using multiple levels so that you can easily identify the product with the most units sold for each sales rep (continent). In the answer sheet, list the sales rep name, month, product and highest monthly units sold. (Complete table on the answer sheet for 12-16) Example: Continent Sales rep name, month, product, units sold
17. What additional excel feature should have been included in this project? 18. How could the activities currently included in this project be improved?
Down below is the spread sheet that is going into
Excel.

Step by Step Solution
There are 3 Steps involved in it
Step: 1

Get Instant Access to Expert-Tailored Solutions
See step-by-step solutions with expert insights and AI powered tools for academic success
Step: 2

Step: 3
Ace Your Homework with AI
Get the answers you need in no time with our AI-driven, step-by-step assistance
Get Started
Database Security
Authors: Alfred Basta, Melissa Zgola
1st Edition
1435453905, 978-1435453906